
Ben Raymond
Previously, we described the colour patterns in Grevillea flowers across Australia. The results showed a broad spatial pattern, with red being most dominant in the southern parts of the continent. The input data to those analyses were flower photographs, and the spatial locations at which each species has been recorded to be present. From each of the photographs, we extracted a palette giving the colours present in the flowers and their relative frequencies.
Quantifying within-species colour differences
Given the colour palette corresponding to flowers from a particular taxon (species or sub-species), the degree of colour variation within that palette can be quantified, using a fairly simple procedure:
- Select two pixels at random from the colour palette. Use the prevalences of colours within the flower as sampling weights, so that the more dominant colours are more likely to be selected.
- Convert the two colours to hue-saturation-value (HSV) colourspace, and calculate the Euclidean distance between them. Some care needs to be taken with the hue channel, because it is circular (a hue value of 0 is red, 1/3 is green, 2/3 is blue, and back to red again at 1).
- Repeat this procedure for a large number of randomly selected pixel-pairs, and take the average of all of the distances.
This gives an index of colour variability (how dissimilar in colour are two randomly-selected pixels likely to be?). For species that have consistent flower colour patterns (i.e. all of the flowers of the species are similar in their colouration) then this value represents the within-flower colour variability. High values might indicate, for example, that the perianth is a different colour to the style, as with Grevillea scortechinii. Alternatively, if the species is one that has different colour variants (and if the colour palette adequately represents that range of variants) then this value is a more general indicator of within-species flower colour variability. Grevillea alpina, for example, can have flowers that are a single cream, green, yellow, orange, pink, or dull red colour, or combinations of these.
Colour variability patterns
Does within-species colour variability depend on the dominant colour of the flower? The mode of the hue distribution within a colour palette (i.e. the most likely colour in that palette) can be used as an indicator of the predominant colour.
This is plotted against within-species colour variability in the top panel of Figure 1. The within-species colour variability in red species is clearly higher than that in yellow/orange species. The pattern to either side (magenta/fuschia on the left, and green on the right) is less clear, with only a few species with these predominant colours. Similarly, within-species colour variability can be plotted as a function of colour saturation (Figure 1, lower panel). Colour variability increases with saturation (i.e. pale colours are associated with lower colour variability), although colour variability appears to decrease again for heavily saturated (very dark) colours.
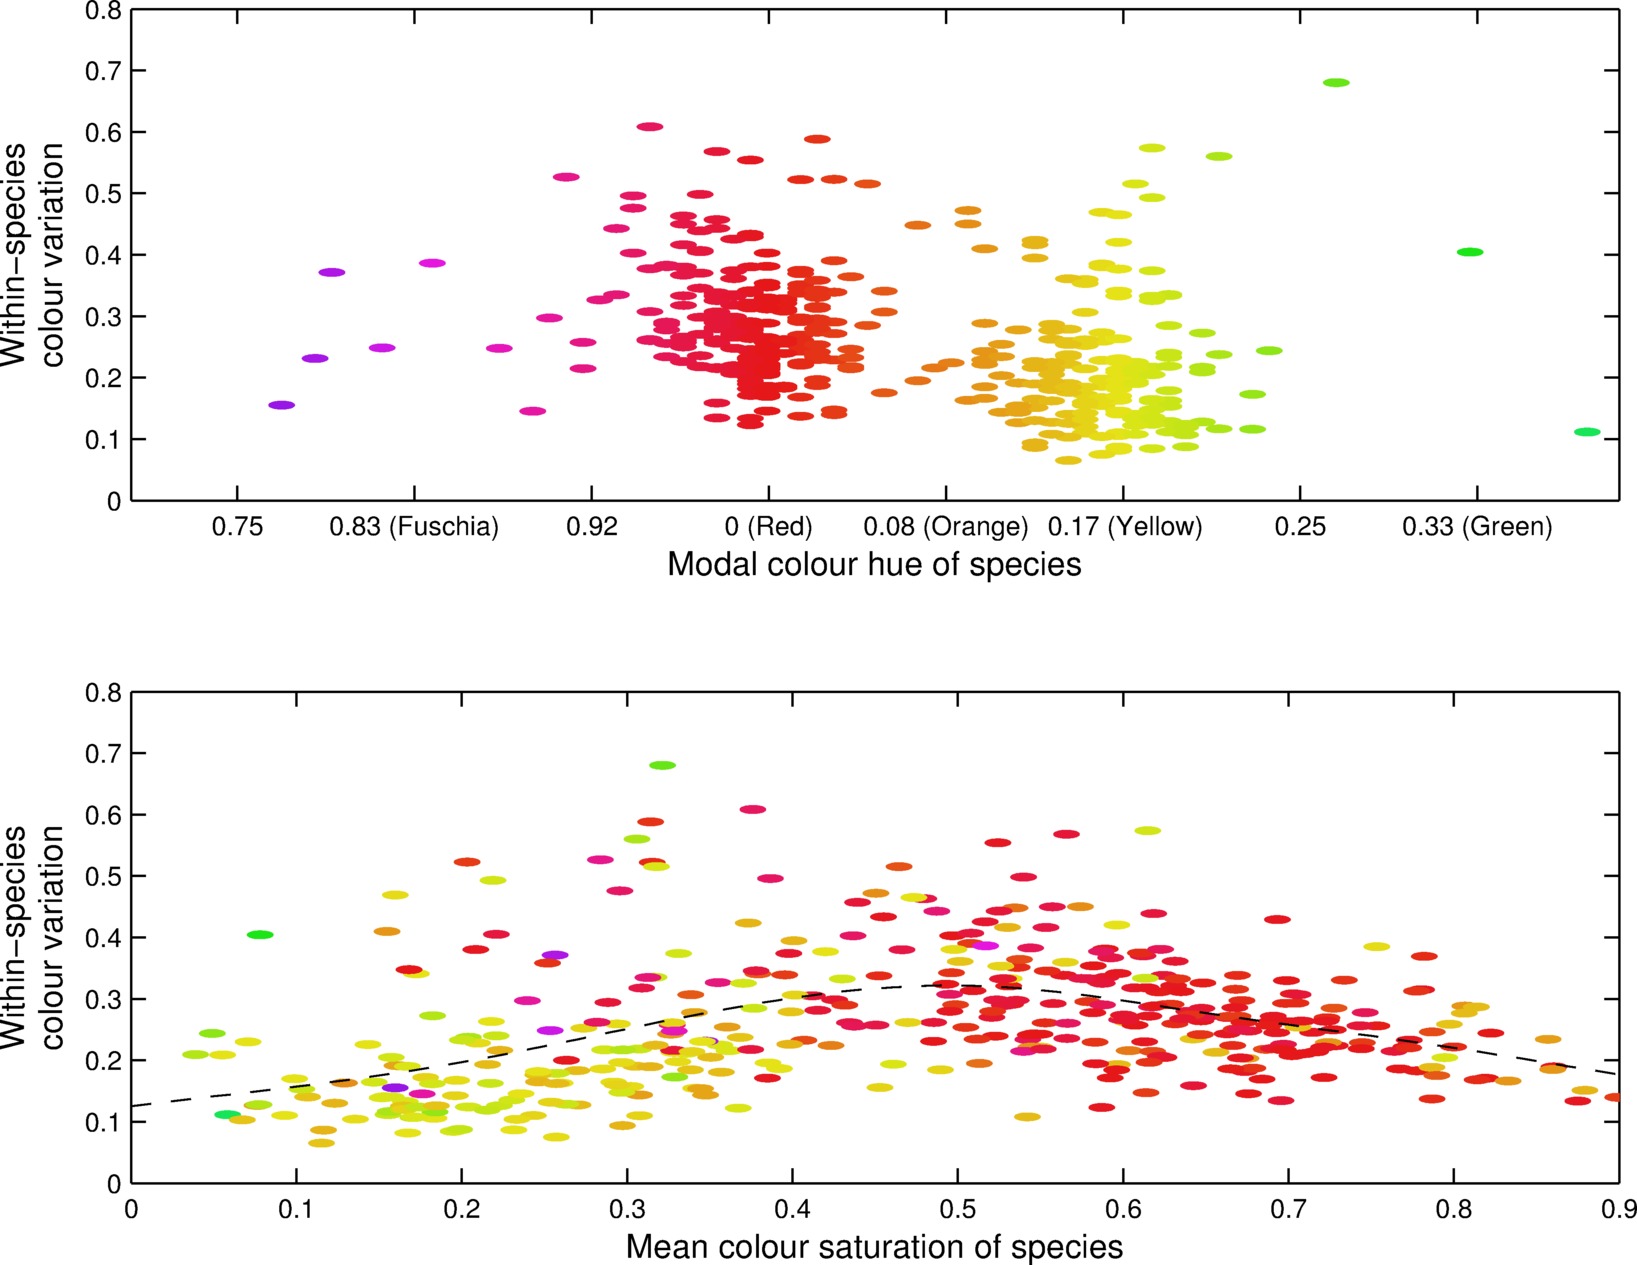
Figure 1: Within-species colour variability plotted against the predominant colour of the species (top) and the mean colour saturation (bottom). The colour of each point matches the ``modal colour hue" value in the top panel, and is the same in both panels. Dashed line shows smooth fit for reference
There are several interpretations that might partly explain these patterns. Some example colour palettes for predominantly red and predominantly yellow/orange species are shown in Figure 2. Flowers with predominantly red colour palettes tend to also have contrasting colours present on the flower — e.g. Grevillea beardiana, which has a yellow tip to the style. The contrasting colours might be related to the vision system or behaviour of their pollinators (see e.g. Rodríguez-Gironés & Santamaría, 2004). The predominantly-yellow palettes do not seem to have a similar tendency towards contrasting colour elements.
Other aspects of the within-species colour variability differences might simply be quirks of the way that colour differences have been quantified. For example, many colour palettes, both red and yellow, have green elements. Green (in RGB or HSV colour space) is closer to yellow than it is to red, and so red flowers with green elements will appear to be more colour-variable than yellow flowers with similar green elements.
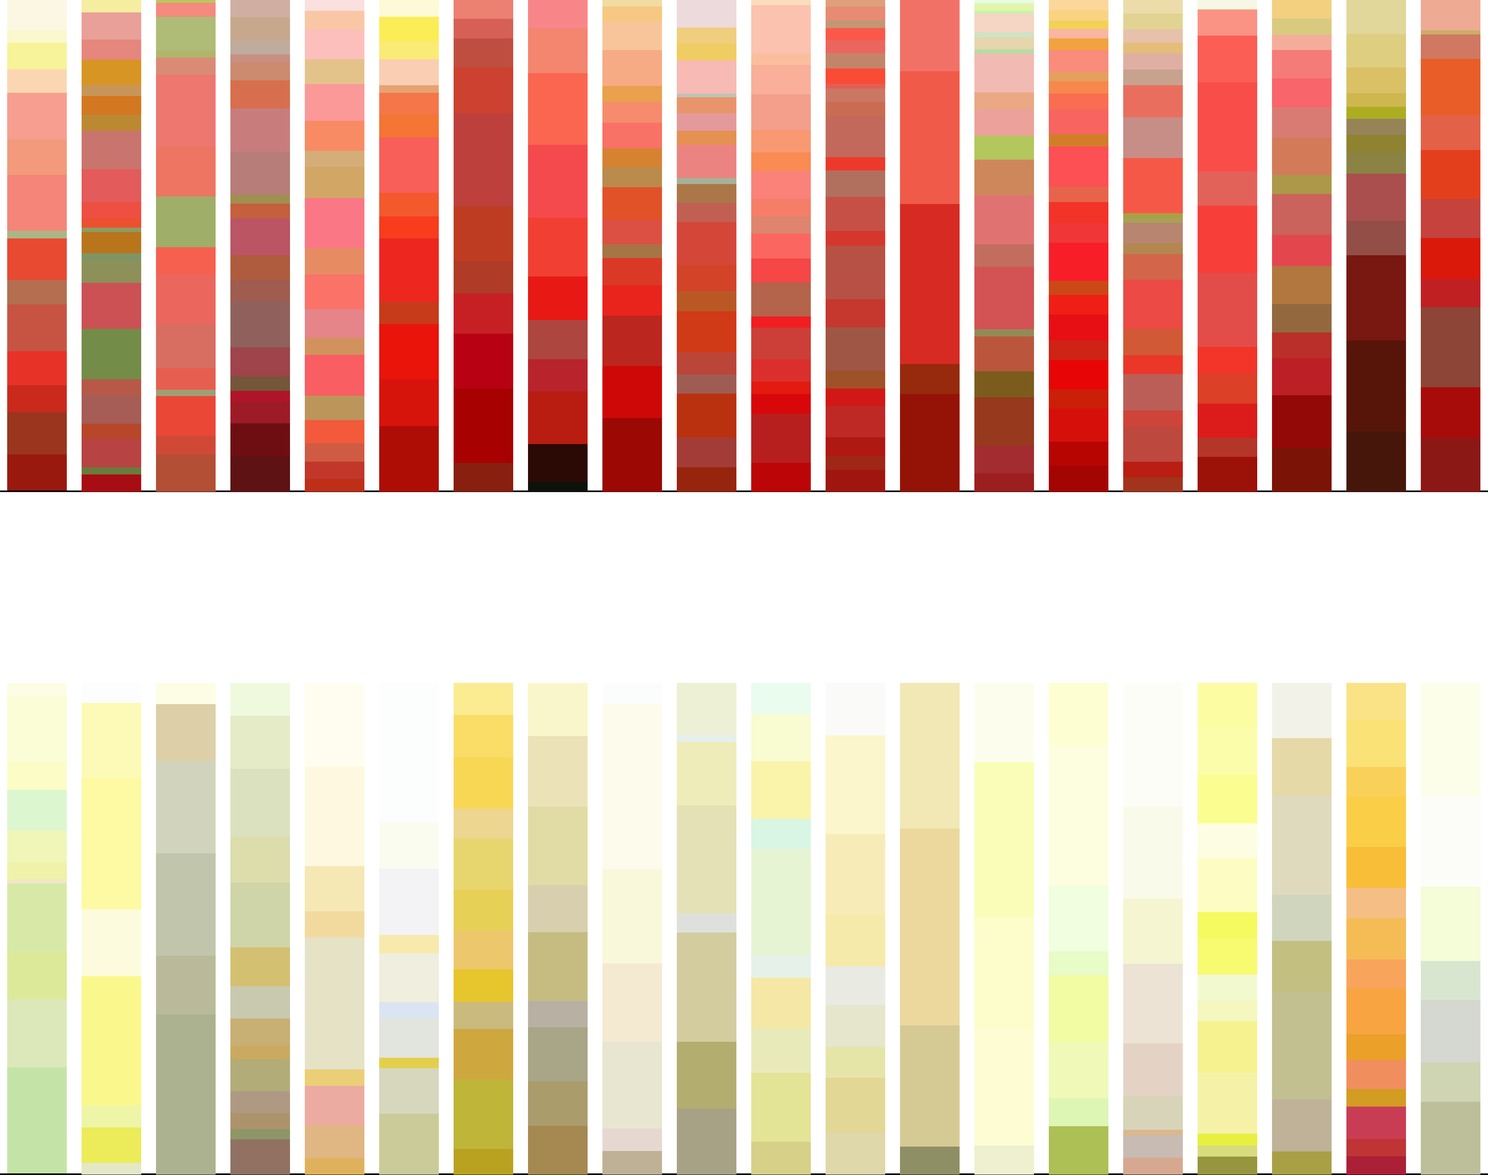
Figure 2: Example colour palettes of predominantly red (top) and predominantly yellow/orange (bottom) species
Spatial colour variability
Within-species colour variability values can be mapped back into a spatial context using the occurrence locations of each species. Figure 3 shows the average within-flower colour variability across Australia. Inland areas of central Australia appear to have relatively uniformly-coloured flowers, whereas areas closer to the coast, particularly in southern regions, show higher within-flower colour variability.
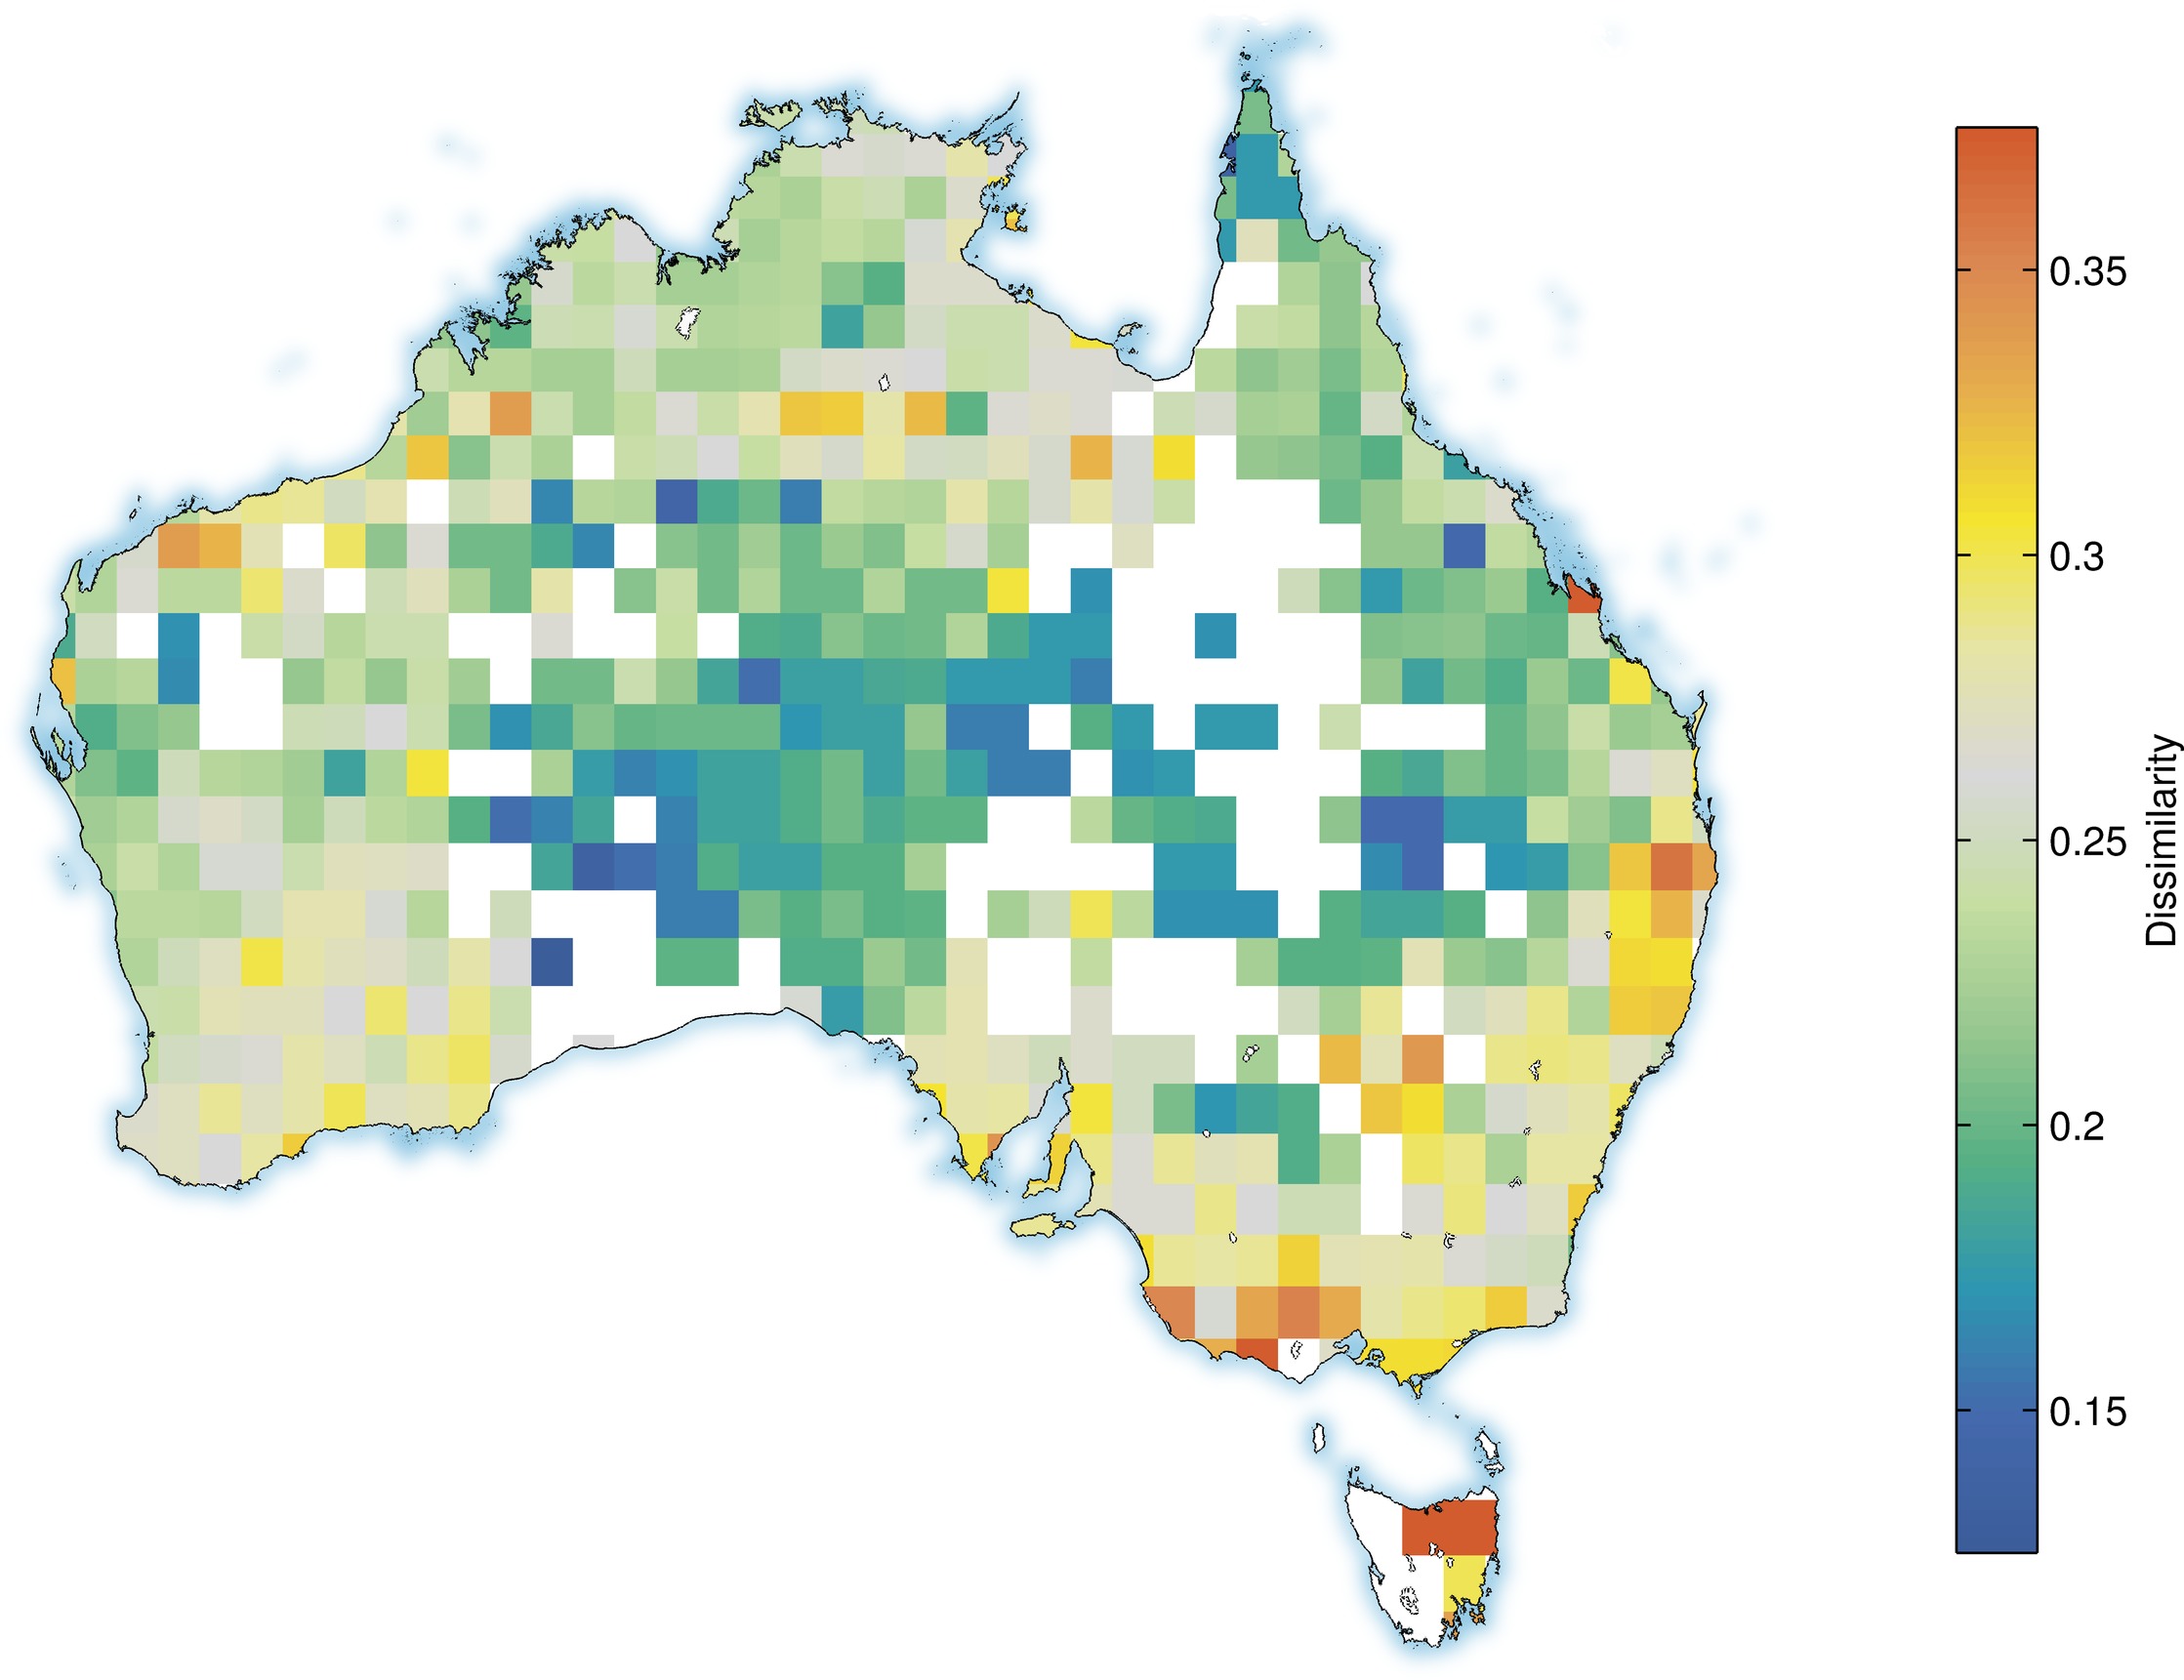
Figure 3: Spatial pattern of within-species flower colour variation

Figure 4: Original map of flower colour palettes
Not surprisingly, this spatial pattern of within-species colour variability shows a striking similarity to the colour pattern in the original article (reproduced here in Figure 4). The southern parts of the continent, which have predominantly red flowers, are also those with high colour variability.