
New attacking analysis app
2020-02-04
Ben Raymond, Adrien Ickowicz, Mark Lebedew.
A new volleyball analytical app! Analyze your team or opposition’s attacking patterns and effectiveness, with a host of options for subsetting and filtering your data.
Some example plots
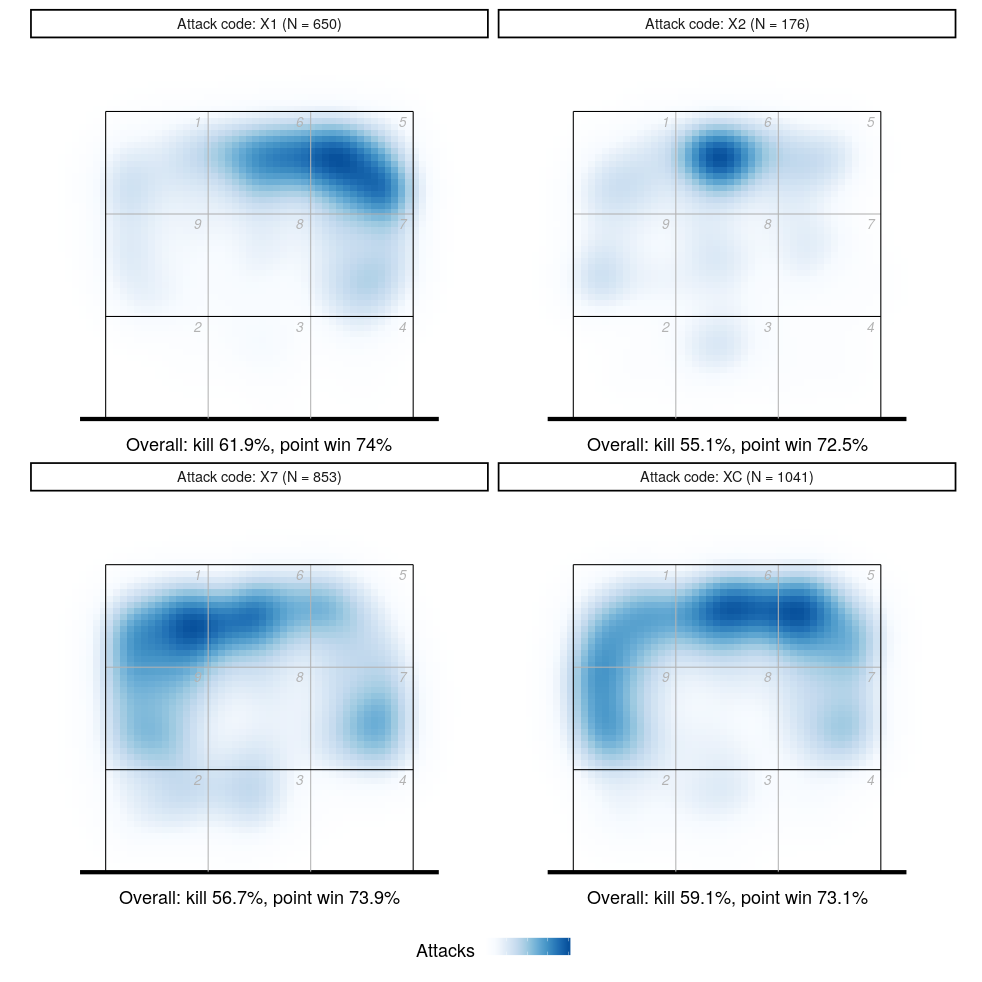
Quick attack heatmaps, broken down by attack code (i.e. different quick attacks. “X1” is a standard quick close to the setter, “X2” is a quick behind, and “XC” and “X7” are quick attacks with the middle at a distance from the setter):
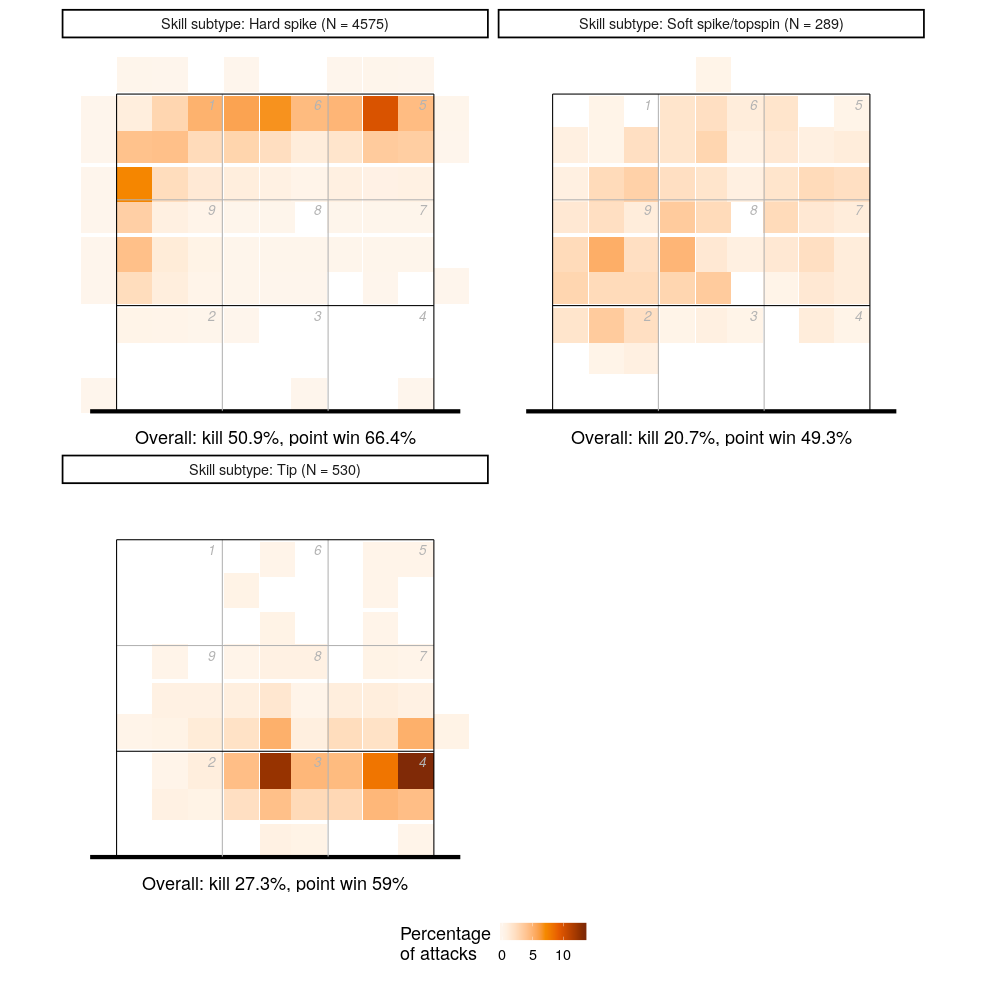
Distribution of right-side attacks (front and back row), in one-metre squares, and broken down by hit type (hard spike, soft spike/topspin, and tip):
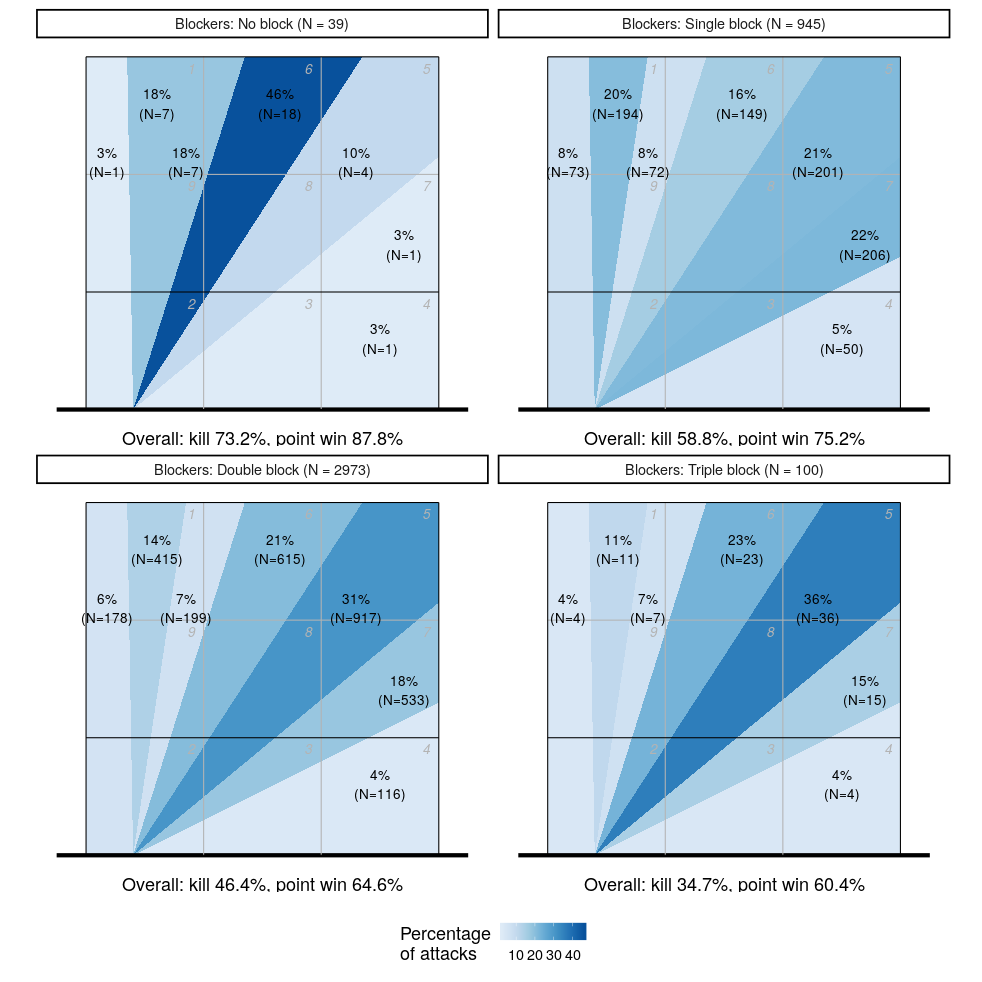
Do the angles that attackers hit vary depending on how many blockers they are facing? Left-side (X5) attack angles by number of blockers:
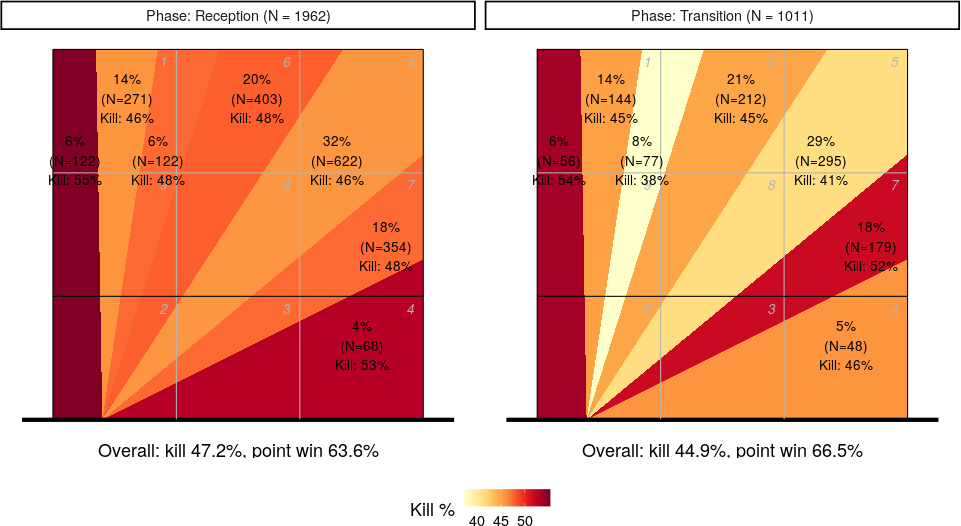
Attack kill percentage for left-side (X5) attacks, on serve reception compared to attacks in transition:
And finally plots showing individual backrow pipe attacks, both “XP” attacks (normal pipes) and “XB” (pipes offset slightly to the right). You can see a small number of XB attacks that appear to have originated from the middle of the court, suggesting that perhaps their starting coordinates need adjustment, or maybe they should have been scouted as “XP” (normal pipe) attacks?

Explore the app for yourself.