
Identifying defensive systems
2020-01-15
Ben Raymond, Adrien Ickowicz, Mark Lebedew.
An important part of match preparation is to understand our opposition’s defensive systems. One way to do this is obviously to watch them play, but can we get this information from scouted match data? If we have a collection of match files, this would allow us to quickly get insights into an opponent’s defensive system.
Many scouts include coordinate information on attacks (that is, the precise court location from which an attack was made, and where the ball went to). For attacks that were followed by a dig, we therefore have the location from which the dig was made, and the player that made it. Not all attacks are scouted with an associated dig (either because no defender got a touch on the ball, or it was a kill and the scout did not include the failed dig attempt), but this does not matter for our purposes.
In these examples we use data from 2017/18 Polish PlusLiga.
Let’s start by plotting all of the dig data from all teams, but with a separate plot for each rotation and play phase. Rotation “P1” means that the setter of the defending team is in position 1, “P2” in position 2, etc. Phase “Breakpoint” means that the defending team is serving, and “sideout” means that the defending team is receiving.
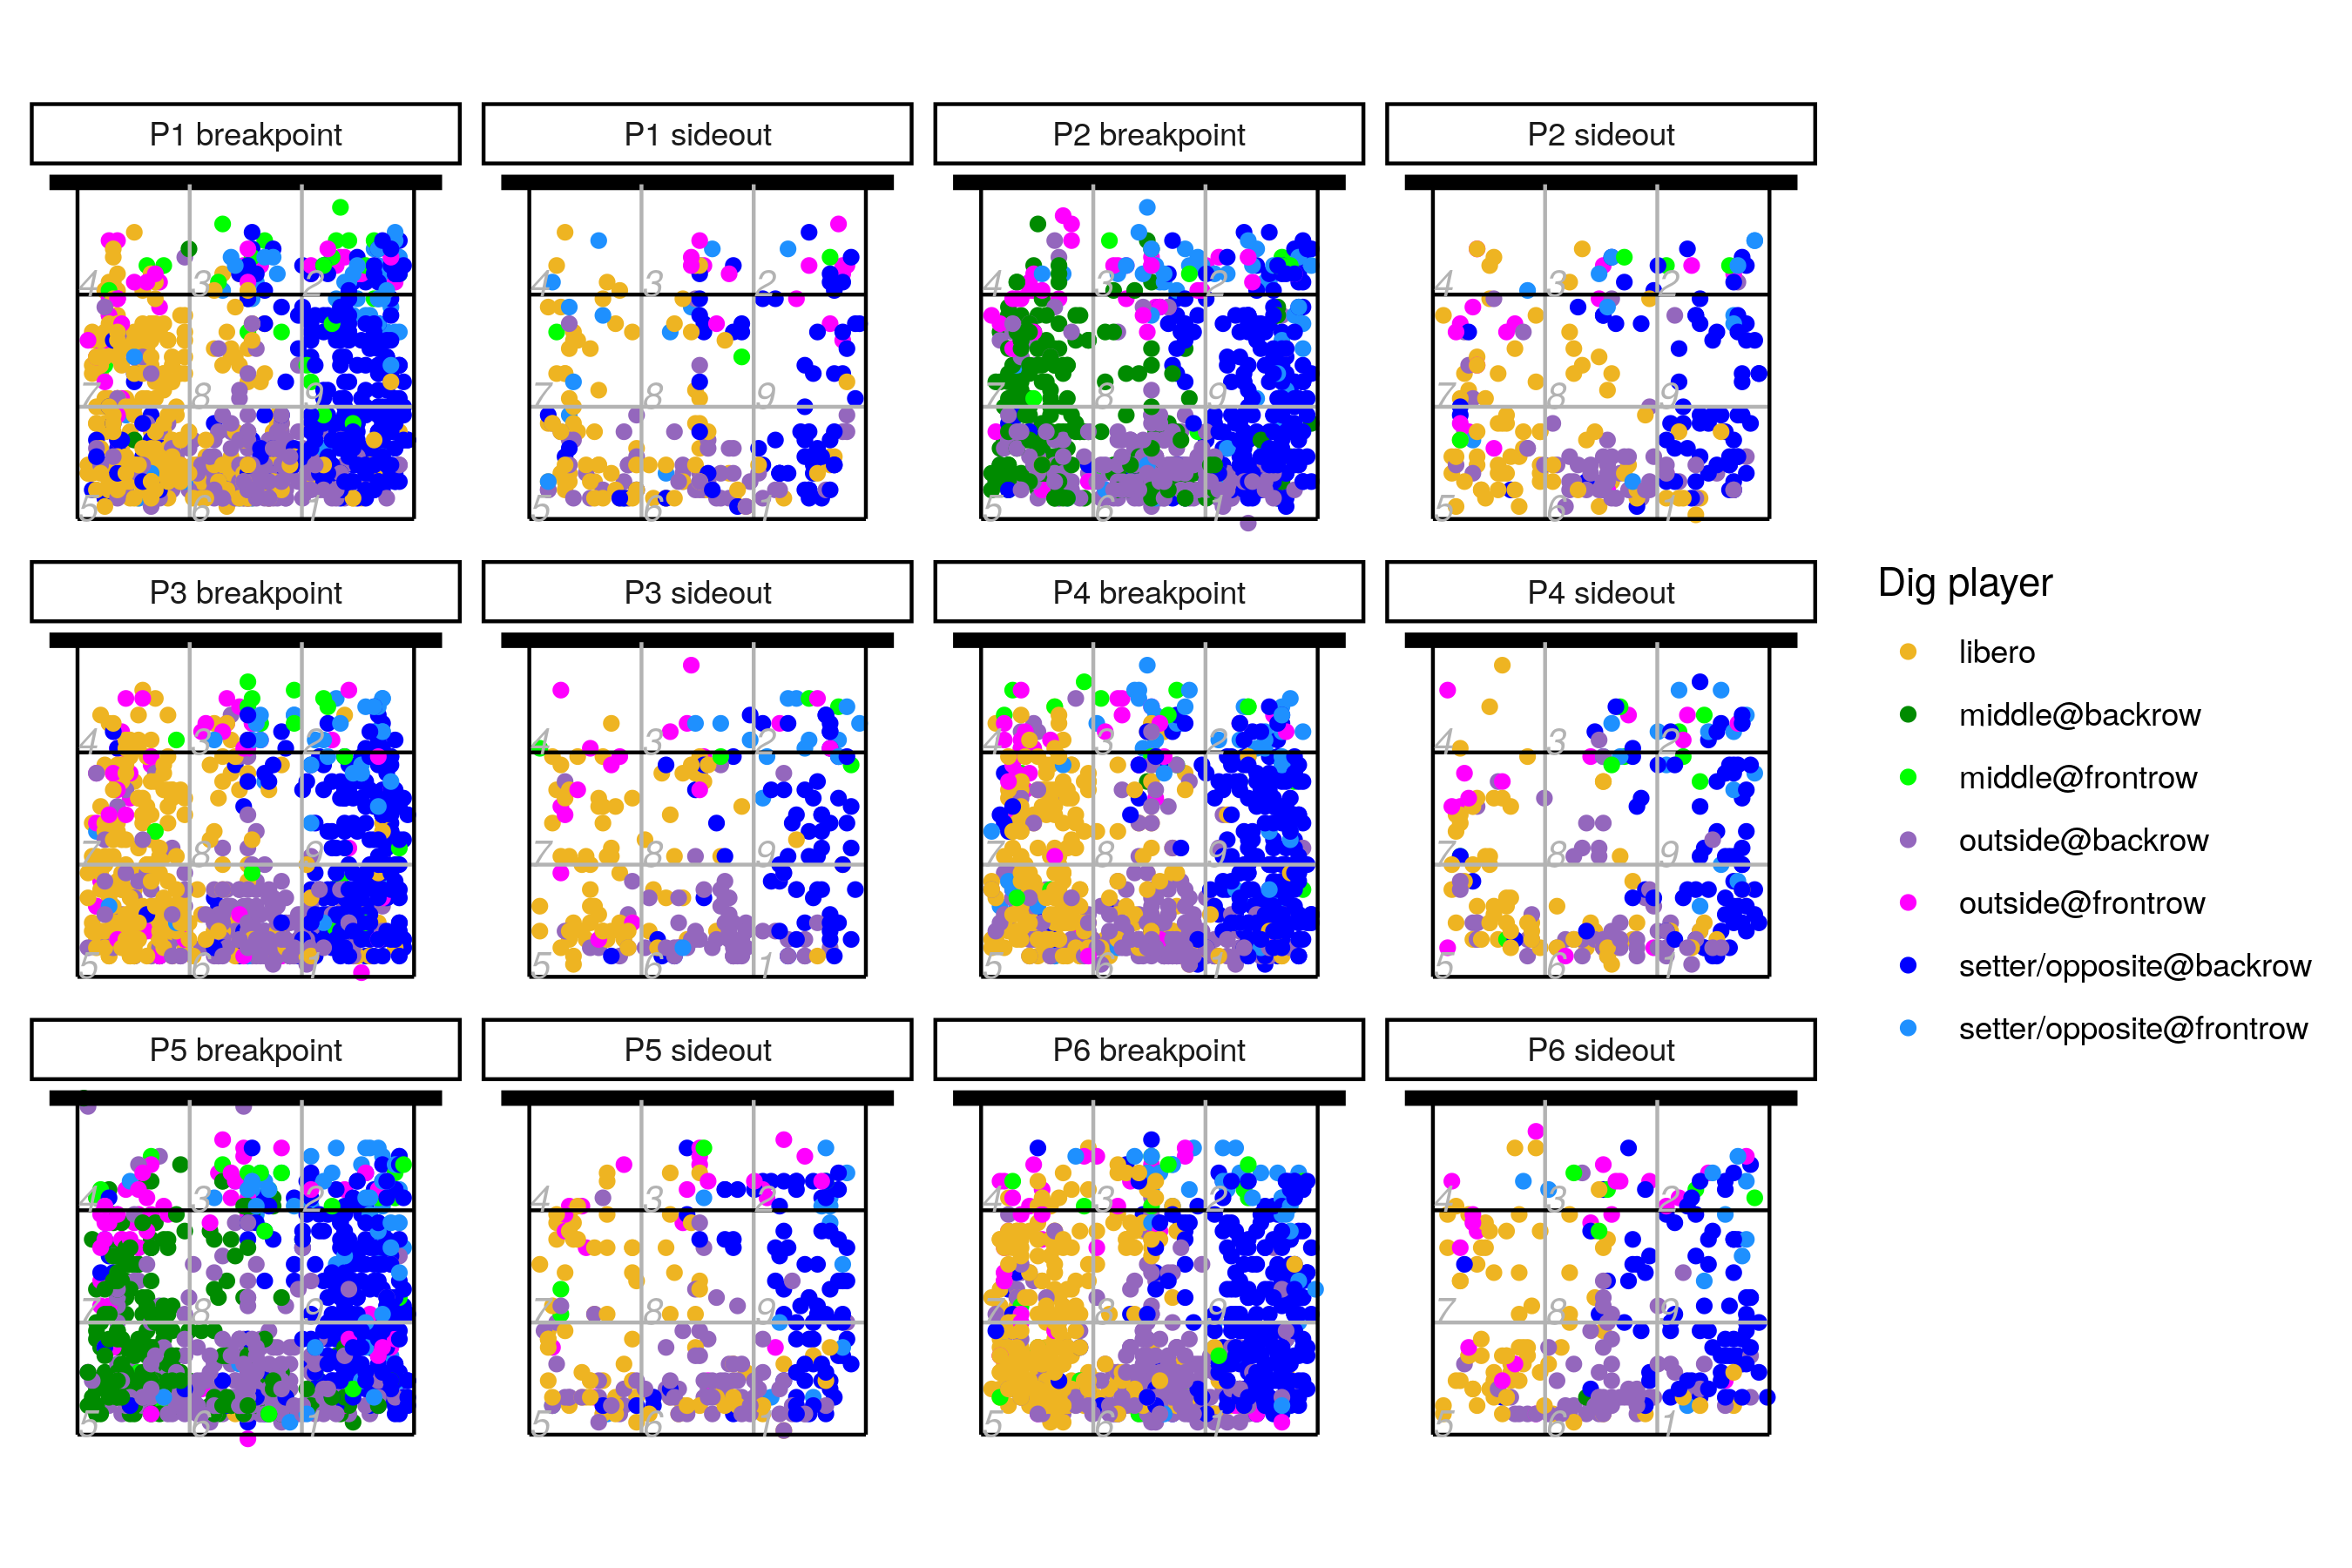
Some things to note:
there are more points on the plots (i.e. more digs) in breakpoint phase than in sideout, because so many rallies in men’s volleyball don’t last longer than the first attack
many of the plots look similar, with the libero defending in 5, the back-row outside hitter in 6 (so that they are available to hit pipe attacks), and the setter or opposite in 1. A priori we expect some departures from this general pattern:
- in the “P1 sideout” rotation, the setter is in position 1 with the front-row outside hitter in position 2. Normally the outside hitter would attack from 4, but because the team is receiving the serve the outside hitter does not have time to swap with the opposite. In P1 sideout the outside hitter therefore attacks from 2, and defends from there as well. Look for the pink points on the right-hand side of the court in the “P1 sideout” plot, and compare to the other plots where these pink points are generally on the left half of the court
- the P2 breakpoint and P5 breakpoint rotations are also different, because the middle blocker is serving, and therefore is defending in back court as well. In all other rotations, the back-row middle blocker is replaced by the libero (green points instead of yellow).
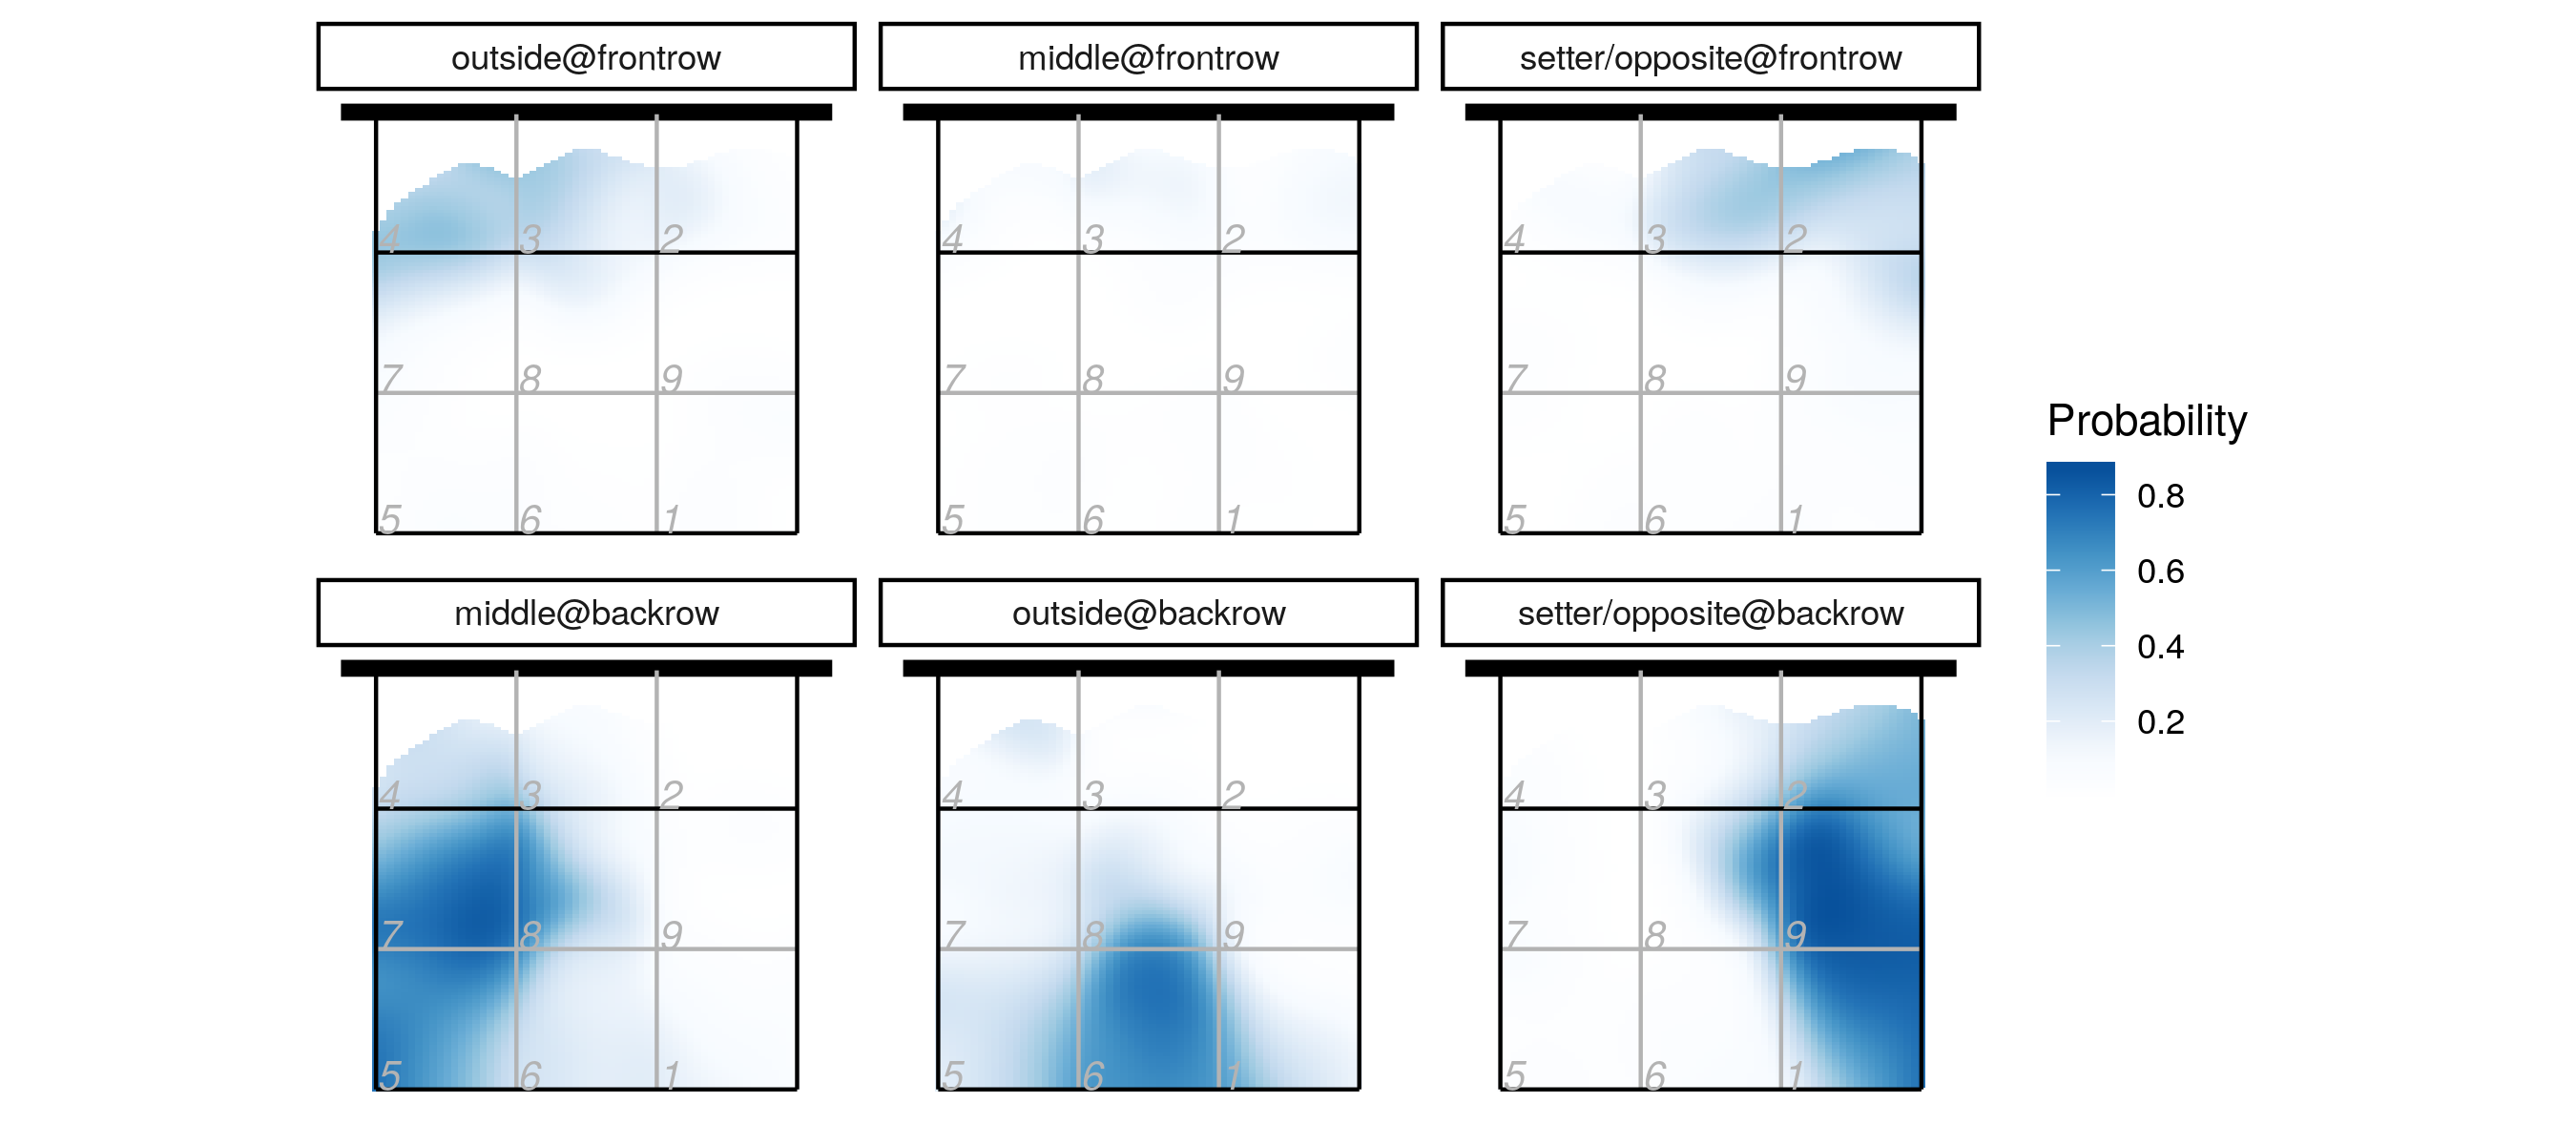
On the basis of these plots, we can go ahead and construct statistical models that describe the areas of the court that each player has defensive responsibility for. We fit the models using all of our data, so the models effectively represent league “average” defensive systems. We fit three models: one for P1 sideout, a second for P2 breakpoint and P5 breakpoint combined, and a third for all other rotations combined.
Each model gives the probability of each player being responsible for defending a given area of the court. For example, the per-player responsibilities in the “P2 breakpoint” and “P5 breakpoint” rotations look like:
And we can combine these into a single map showing the most likely defender for each area of the court (we have excluded the parts of the court close to the net, because so few digs are made there):
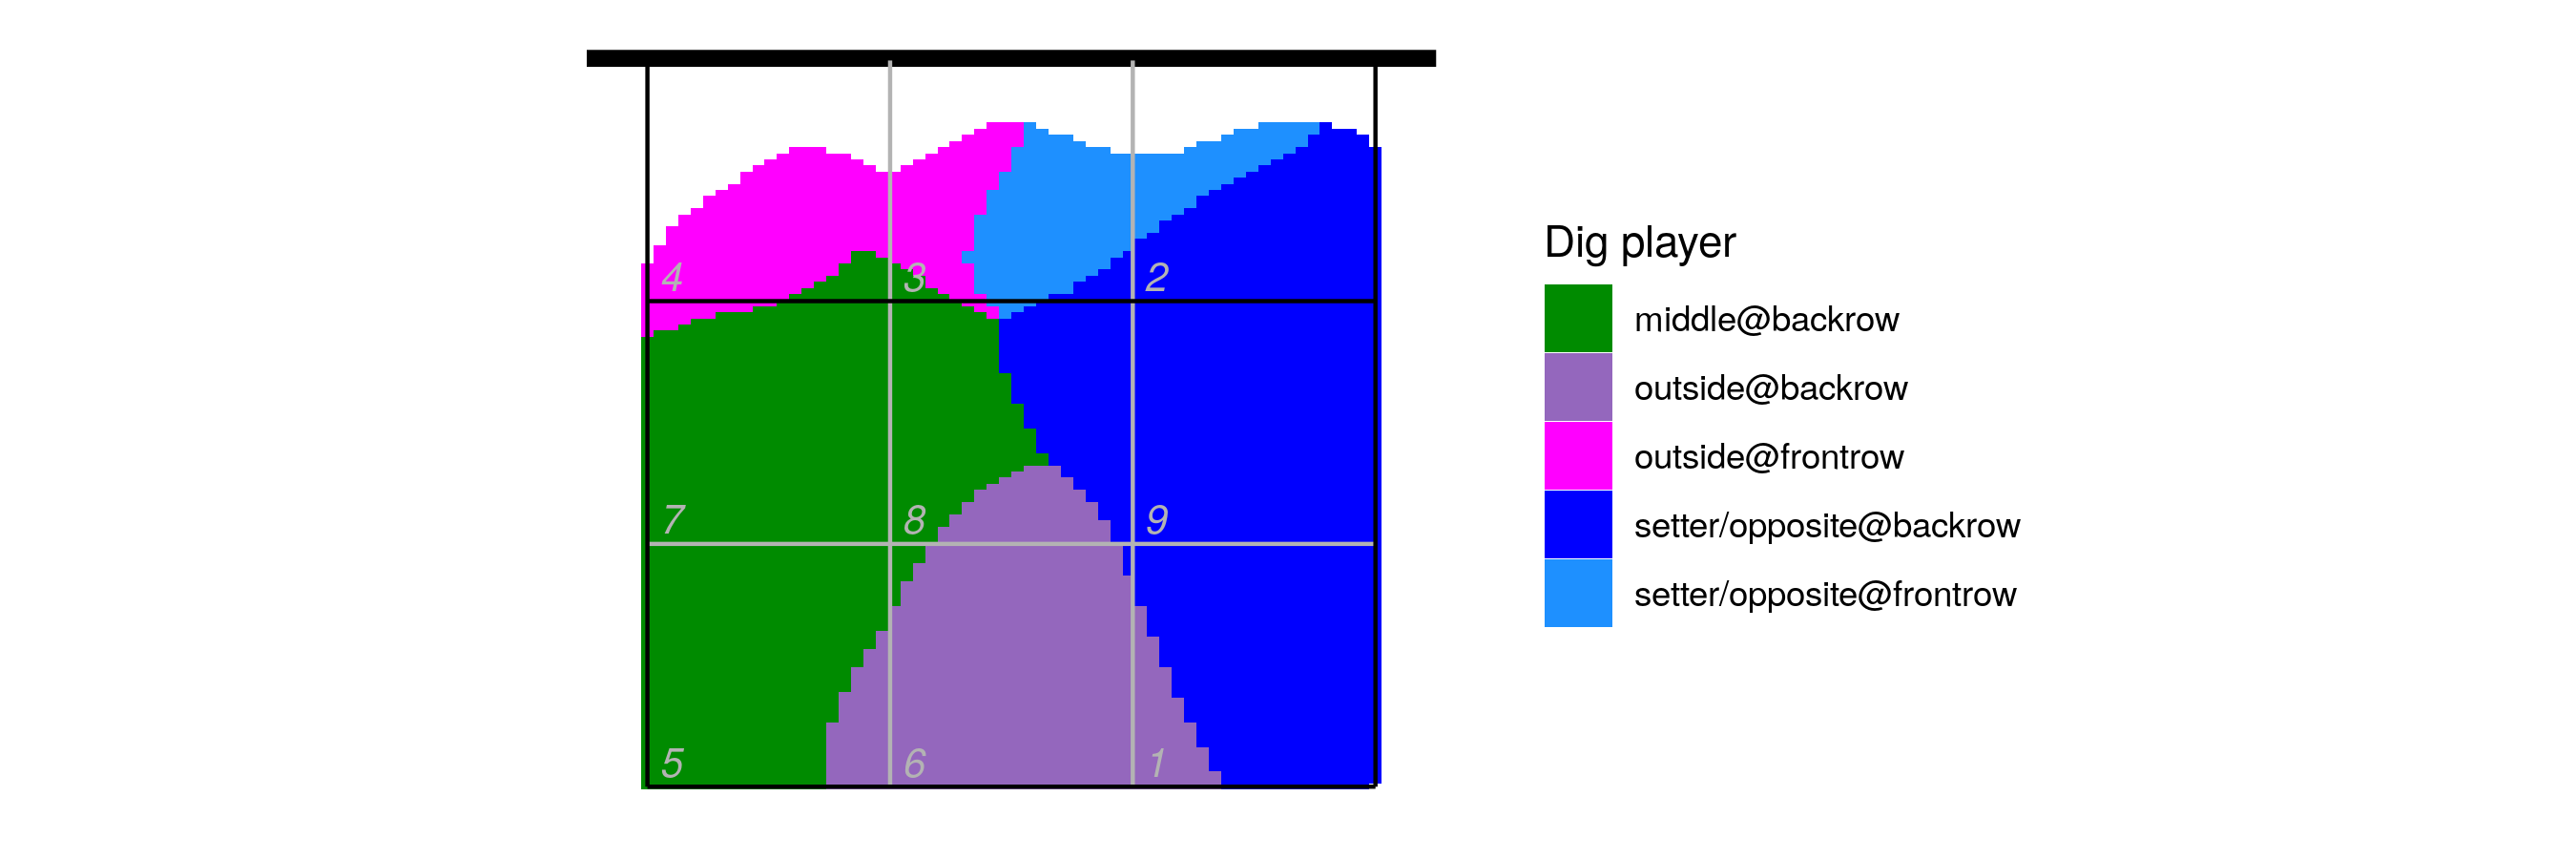
So now we have a nice map showing which players we expect to be defending which areas of the court in the P2 breakpoint and P5 breakpoint rotations, and we can do the same for the other rotations.
Characterizing individual teams
As noted before, these outputs are based on data from all teams combined. But what if we want to examine the defensive system of a particular team? We could repeat the above steps, but using only data from the team of interest, thereby constructing defensive maps from scratch for that team. Alternatively, we could use use our league-wide results as a reference, and look to see whether an individual team’s data either follows the same pattern, or does something different.
To do this we take the scouted data for a particular team in a particular rotation, and calculate how well that data matches its corresponding reference map. A close match would suggest that the map is a good representation of the defensive system of that team. Conversely, if the data are a poor match to the map, this would suggest that the team is not following the same defensive system that the map represents.
This can be done across all teams and rotations, and summarized in a table. The top and bottom few rows of this table (i.e. representing the best and worst matches) are shown below:
Best matches
| Defending team | Rotation | N digs | Match value |
|---|---|---|---|
| Asseco Resovia Rzeszów | P6 sideout | 3 | 1.000 |
| Indykpol AZS Olsztyn | P3 sideout | 10 | 1.000 |
| Łuczniczka Bydgoszcz | P3 sideout | 14 | 0.977 |
| MKS Będzin | P6 sideout | 12 | 0.973 |
| Espadon Szczecin | P2 sideout | 17 | 0.972 |
Worst matches
| Defending team | Rotation | N digs | Match value |
|---|---|---|---|
| PGE Skra Bełchatów | P3 sideout | 9 | 0.706 |
| Indykpol AZS Olsztyn | P5 breakpoint | 39 | 0.697 |
| ONICO Warszawa | P4 sideout | 17 | 0.672 |
| Cuprum Lubin | P3 breakpoint | 53 | 0.663 |
| GKS Katowice | P4 breakpoint | 48 | 0.660 |
Let’s look at one of the well-matched results first: Łuczniczka Bydgoszcz in P3 sideout. The figure below shows the expected map, along with the actual scouted data for this team in this rotation, and (on the right) an indication of how well each scouted dig fits the expected map.
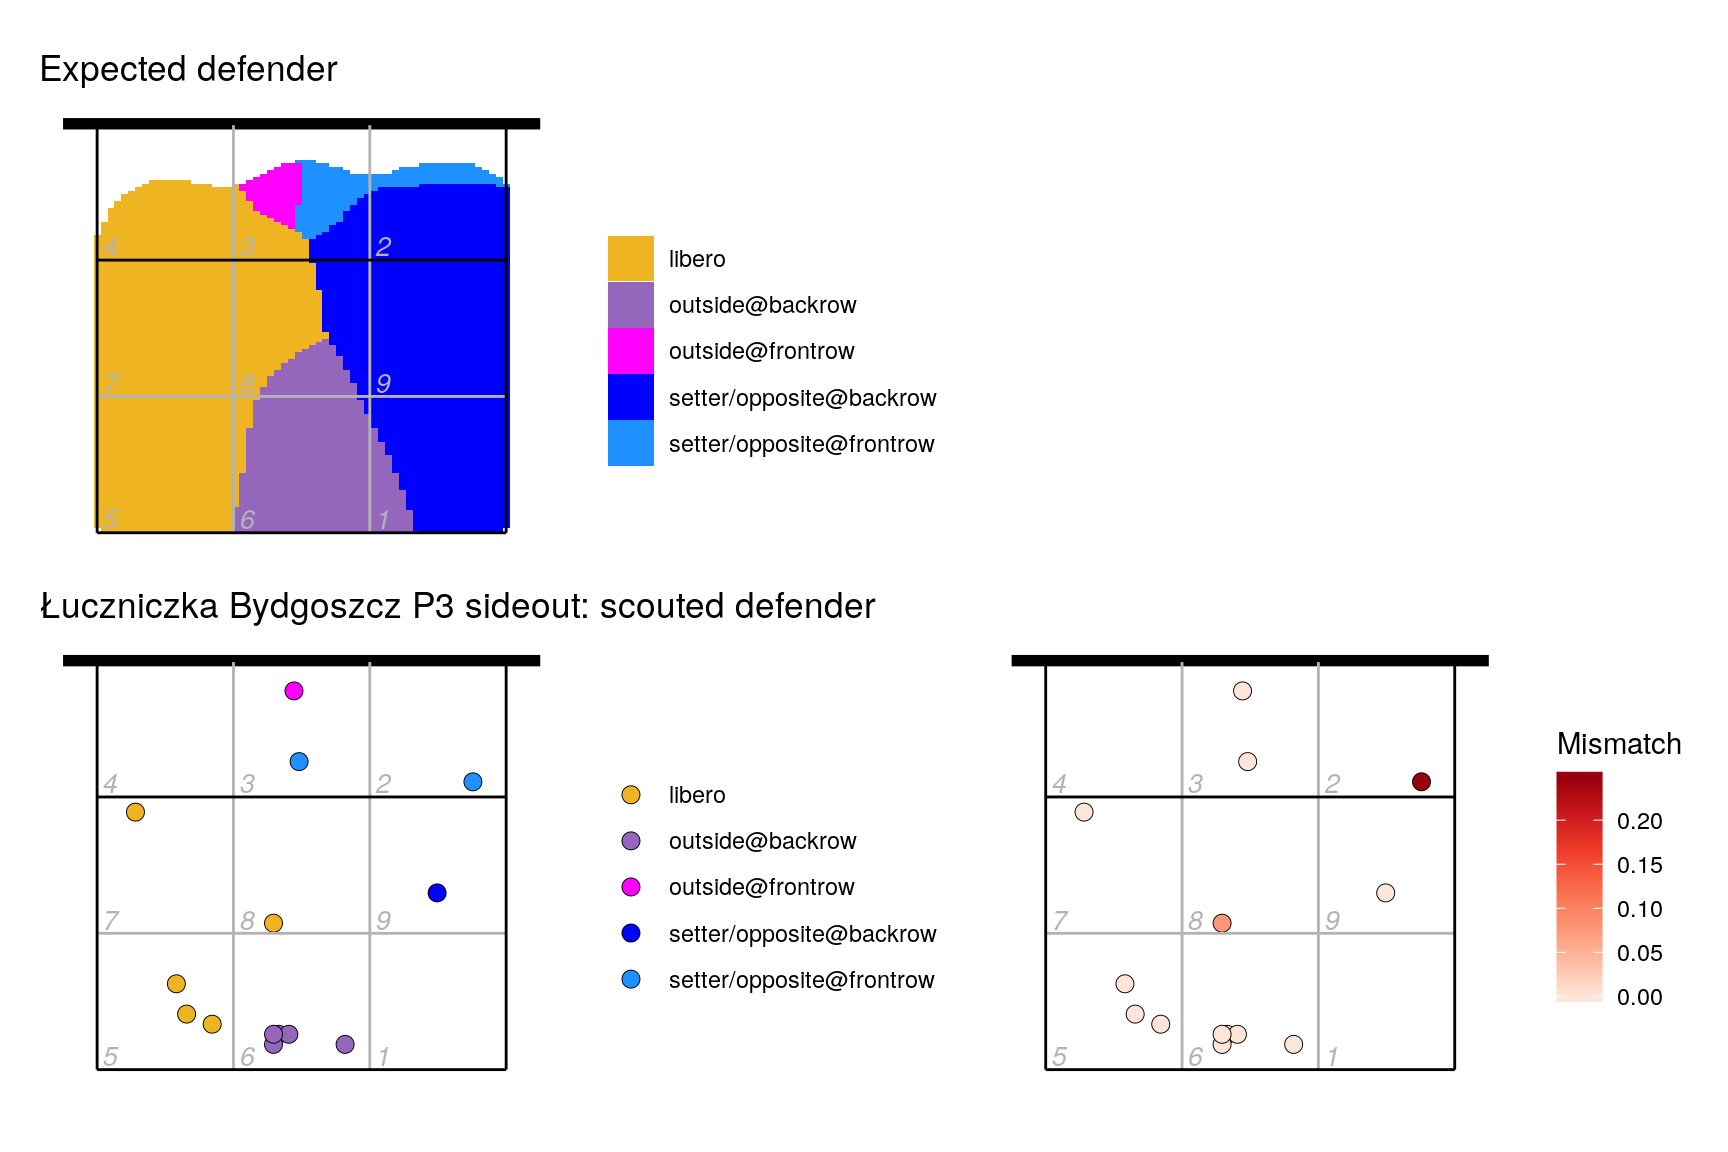
In this case we can see that most of the scouted points correspond well with the map, hence the high overall match score. Even though we don’t have a great deal of data for this team in this rotation (only 14 scouted digs), what we do have is consistent with the idea that they follow the expected defensive pattern.
Now let’s look at one of the examples of a poor match: Cuprum Lubin in P3 breakpoint. The expected map in this case is the same as in the previous example, but the scouted data look somewhat different:
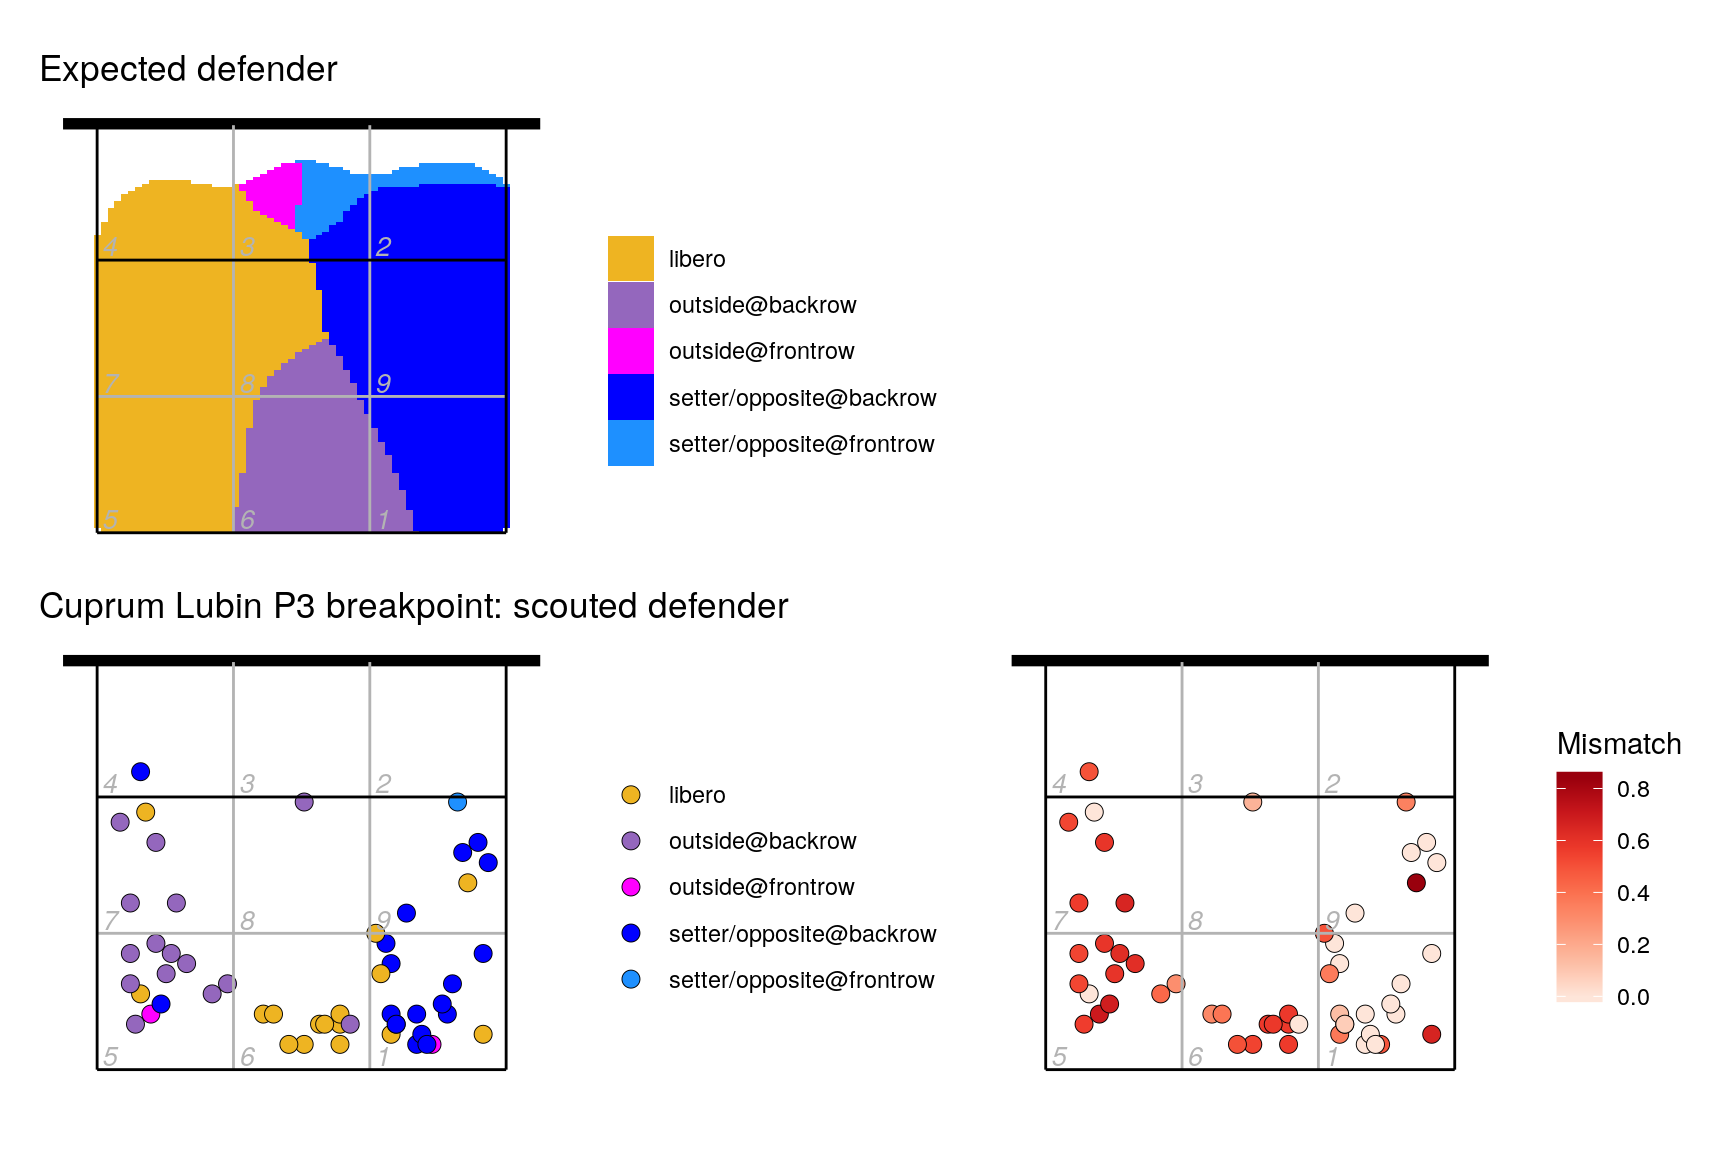
We can see that the scouted data are a poor match to the expected map, which is an immediate flag that this team might be doing something different in this rotation. Looking at the scouted data, we can see that in this rotation the libero defends in position 6 rather than the usual position 5 (the yellow and purple points are swapped relative to the yellow and purple areas of the expected map).
We can see examples of this defensive system in the video clips below. Cuprum is in the foreground in orange tops (with the libero in brown).
P3 breakpoint with the libero defending in 6.
Note that in P3 breakpoint, the libero only defends in 6 against the first opposition attack, and after that defends in position 5. This allows the back-row outside hitter to be ready to make a transition pipe attack through the middle. You can see this in the first “P3 breakpoint” clip.
For comparison, you can also see the same team in P3 sideout rotation.
P3 sideout with the libero defending in 5.
See also this video from Volleyball Explained about the libero defending in position 5 or 6.
Taking it further
This general approach gives a quick way of getting an overview of a team’s defensive system, but also the potential to identify particular defensive patterns that might be worthy of further investigation. In these examples we examined patterns by rotation and play phase, but it would also be possible (data permitting) to examine patterns by other factors such as opponent attack type and location, or by opposing team or individual attacker.