
The value of points in volleyball
2020-10-17
Ben Raymond, Adrien Ickowicz, Mark Lebedew, Jim Dietz.
Every rally in a volleyball match is worth one point — but some points are more valuable than others. Losing the first point of a match probably isn’t cause for concern, but losing the point when you are match point down is clearly a different matter. Critical points in a match are often referred to as “crunch time”.
While crunch time is generally considered to be important (in the sense that teams and players must perform well in these situations in order to win close matches) there isn’t a clear definition of exactly what crunch time is. Furthermore, there must be a range of values in between the extremes of “this point doesn’t matter much” to “crunch time”. Can we get a more nuanced view of “point value”?
Here we take a fairly simple approach, though it relies on having a reasonably-sized data set: first we tabulate all combinations of team scores in the data (that is, serving team score vs receiving team score). Then for each of those combinations, we calculate (as a proportion of the number of times the serving team won the set) how often the serving team won the point, and how often they lost the point. The point value is then the difference between these two proportions.
A point value of zero means that the serving team won the set just as often after winning the point as they did after losing the point. That point therefore made no difference (on average) to the set outcome, so its value is zero. A positive point value means that the serving team won the set more often after winning that point than they did after losing that point. (A negative point value would indicate that on average it was more beneficial for the serving team to lose the point in question, rather than win it. We don’t expect to see many of these, if any.)
Here we are talking about point value in terms of winning a set, but an analogous approach could be used to look at point value in terms of winning a match.
The plot below shows the point value calculated using data from 571 matches over four seasons of the Polish PlusLiga (men’s) league. Negative point values are shown in grey — these are almost certainly due simply to noise in the data, so we mask them out for clarity.
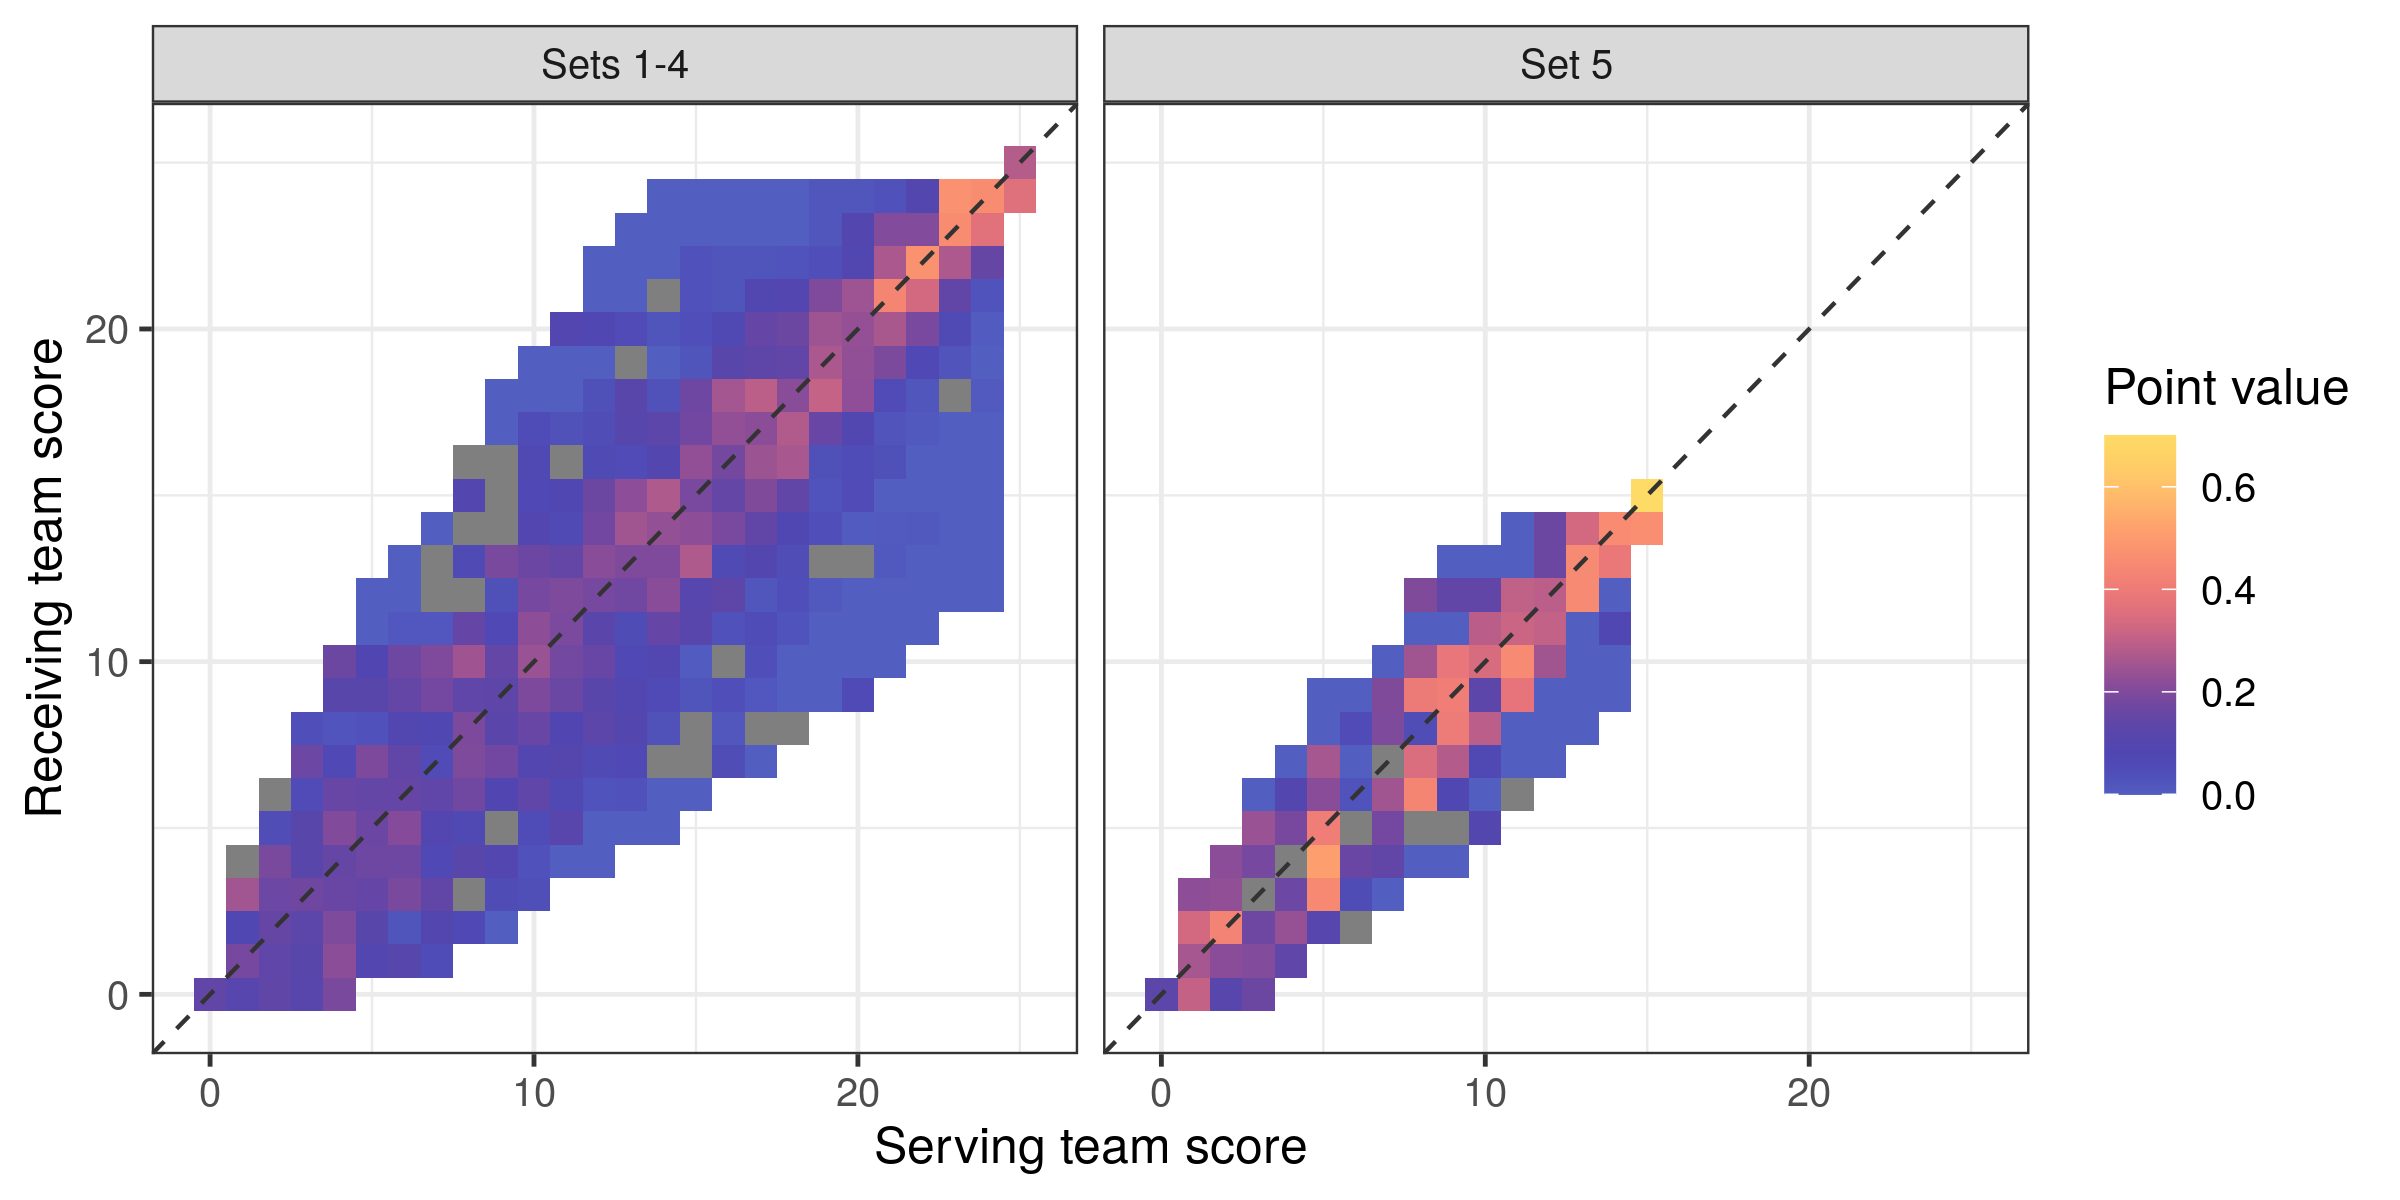
In sets 1–4, the highest point values are (not surprisingly) towards the end of the set when the scores are close, with values showing a fairly smooth increase as the set progresses. Points with large score differentials (e.g. 18–10 or 10–18) are basically worthless: it doesn’t matter if the serving team wins or loses these points, in terms of making a difference to the outcome of the set.
In set 5 the pattern is not quite so clear, perhaps because we have less data (only 121 of the 571 matches went to 5 sets) but also because fifth sets are shorter and therefore more variable in their outcomes. Nevertheless the most valuable points are generally in the latter half of the fifth set when scores are close.
We could use this information to make a quantitative definition of crunch time. Somewhat arbitrarily, we choose a “top 10%” threshold and find the points that lie in the top 10% of values (calculated separately for sets 1–4 and set 5). The above plot is repeated below, but this time with the top 10% most valuable points indicated by white dots …

… suggesting that crunch time in sets 1–4 (in this league, at least) might extend from as early as 14 points (with scores within 2), tightening to a difference of 1 when the scores get above 20. (Obviously we would get somewhat different results if we were to choose a different “top x%” threshold value.)
Another viewpoint
The approach used above probably aligns with how most people think of “crunch time”: points that are critical to winning close matches. However, it’s not necessarily the only or best definition of “point value”. Winning close matches is not the same as winning a lot of matches. If my team does not play well in the early parts of a set, crunch time is irrelevant because we might never find ourselves in a crunch time situation. 23–23 is valuable (it has a point value above of 0.46) but my team will never reach that if they don’t play well enough in the preceding points of the set.
How often does each score combination happen? Let’s look at the proportion of sets in which each score combination occurred:
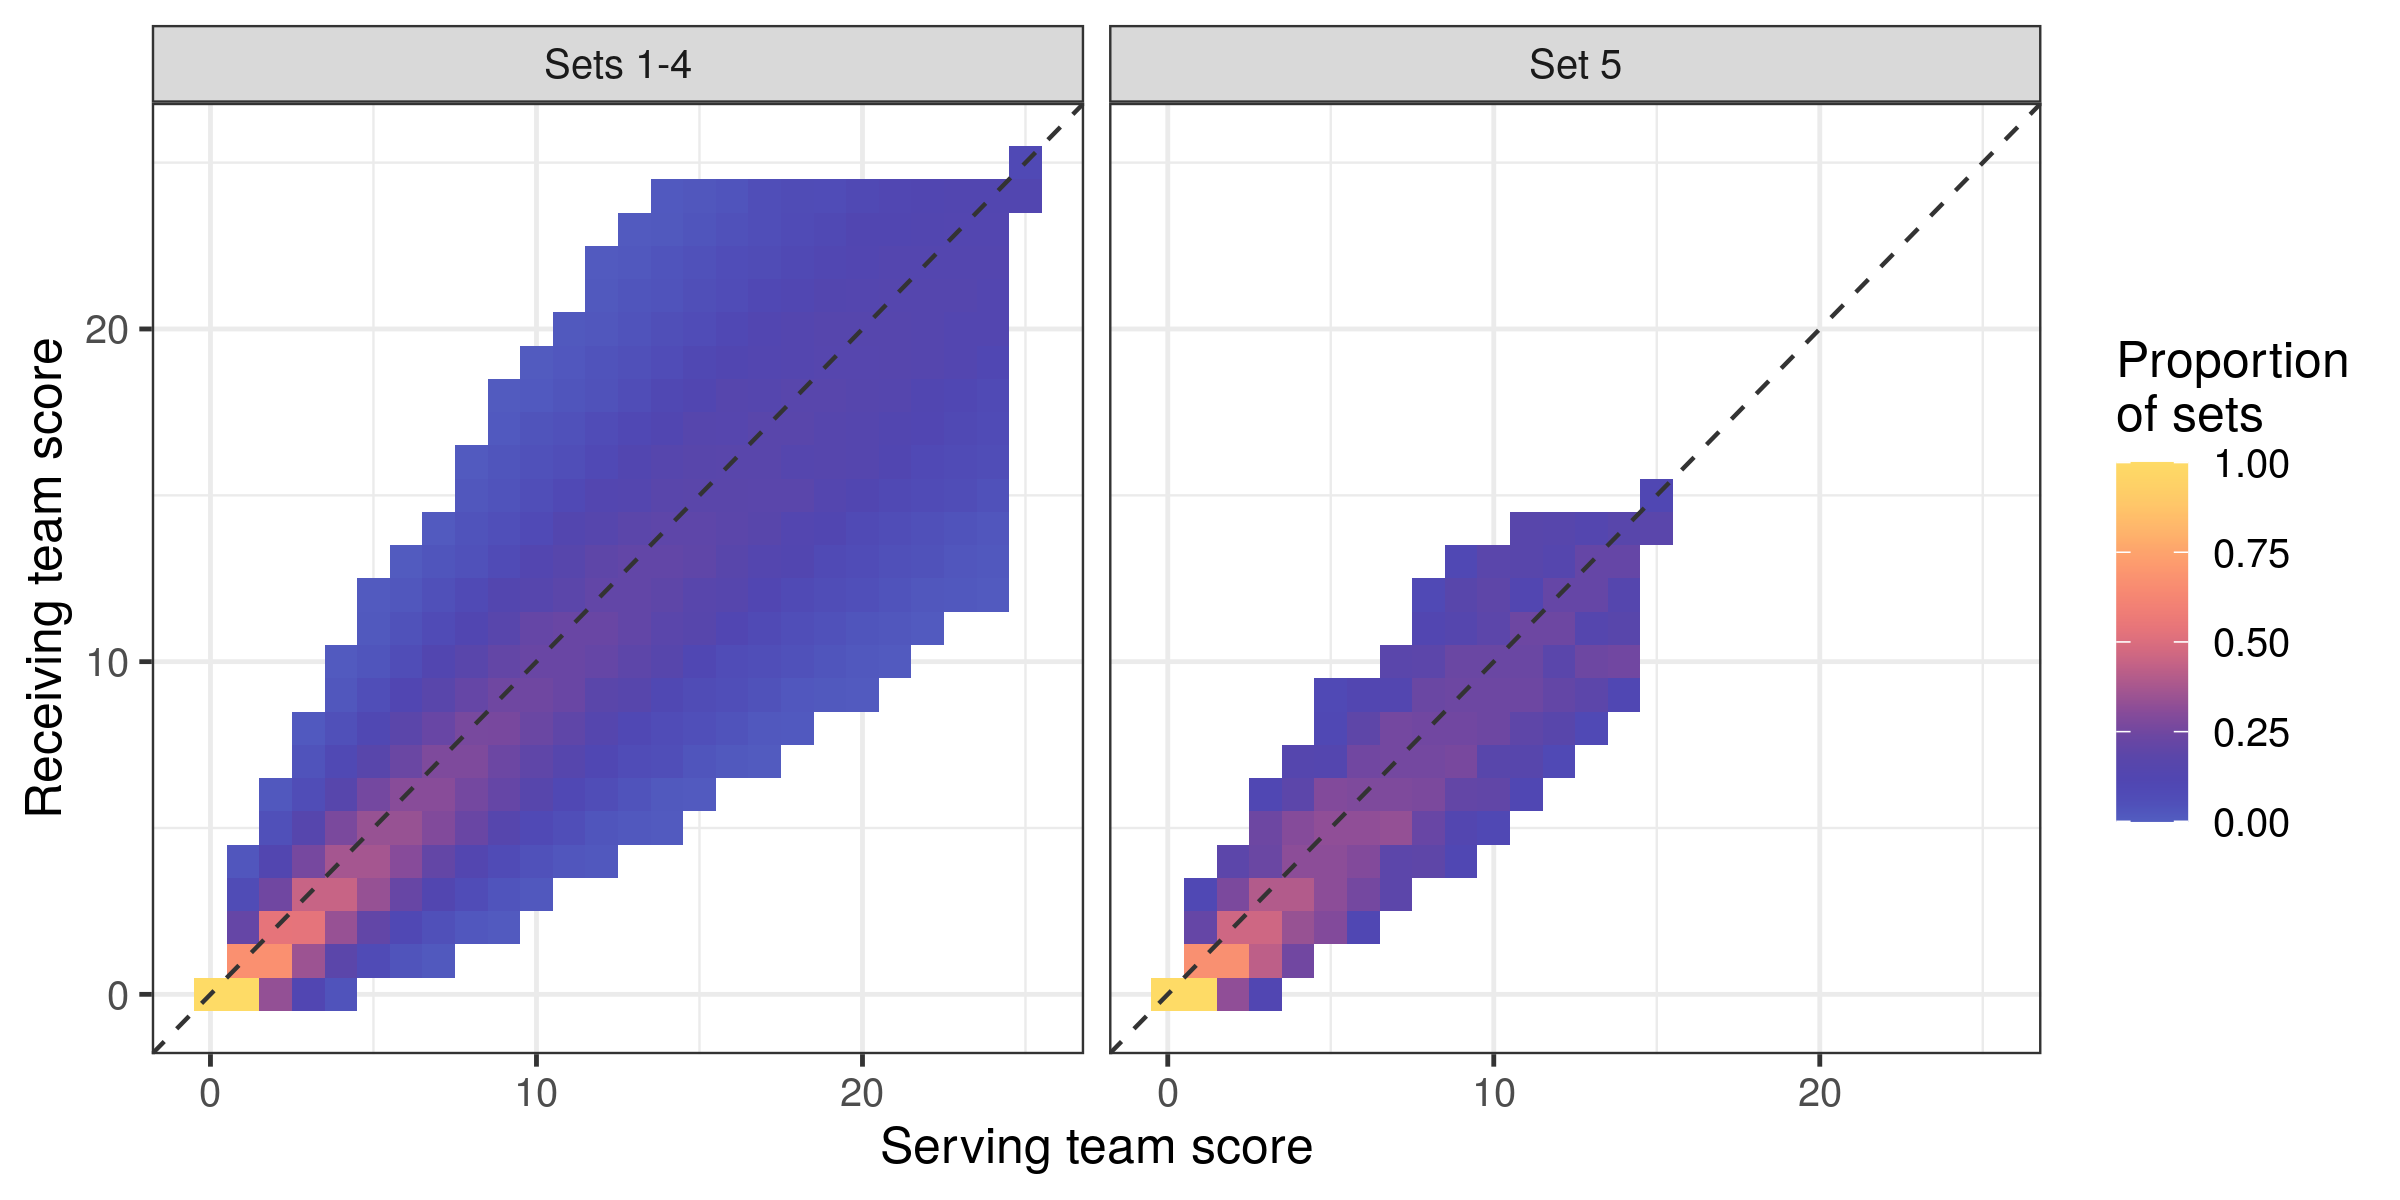
As one would expect, the lower score combinations happen more often (every set must include the scores 0–0 and 1–0, for example — remembering that our score convention here is serving team score – receiving team score) with the possible score combinations fanning out as the set progresses.
What do we get if we weight the value of each point (as calculated above) by the proportion of sets in which it occurred?
By scaling the raw point values according to how often each point is played, we are emphasizing points that are both valuable and common. This “weighted point value” could perhaps identify points that we must consistently perform well in, in order to win more matches. The result is plotted below, again with the top 10% most valuable points marked by white dots:
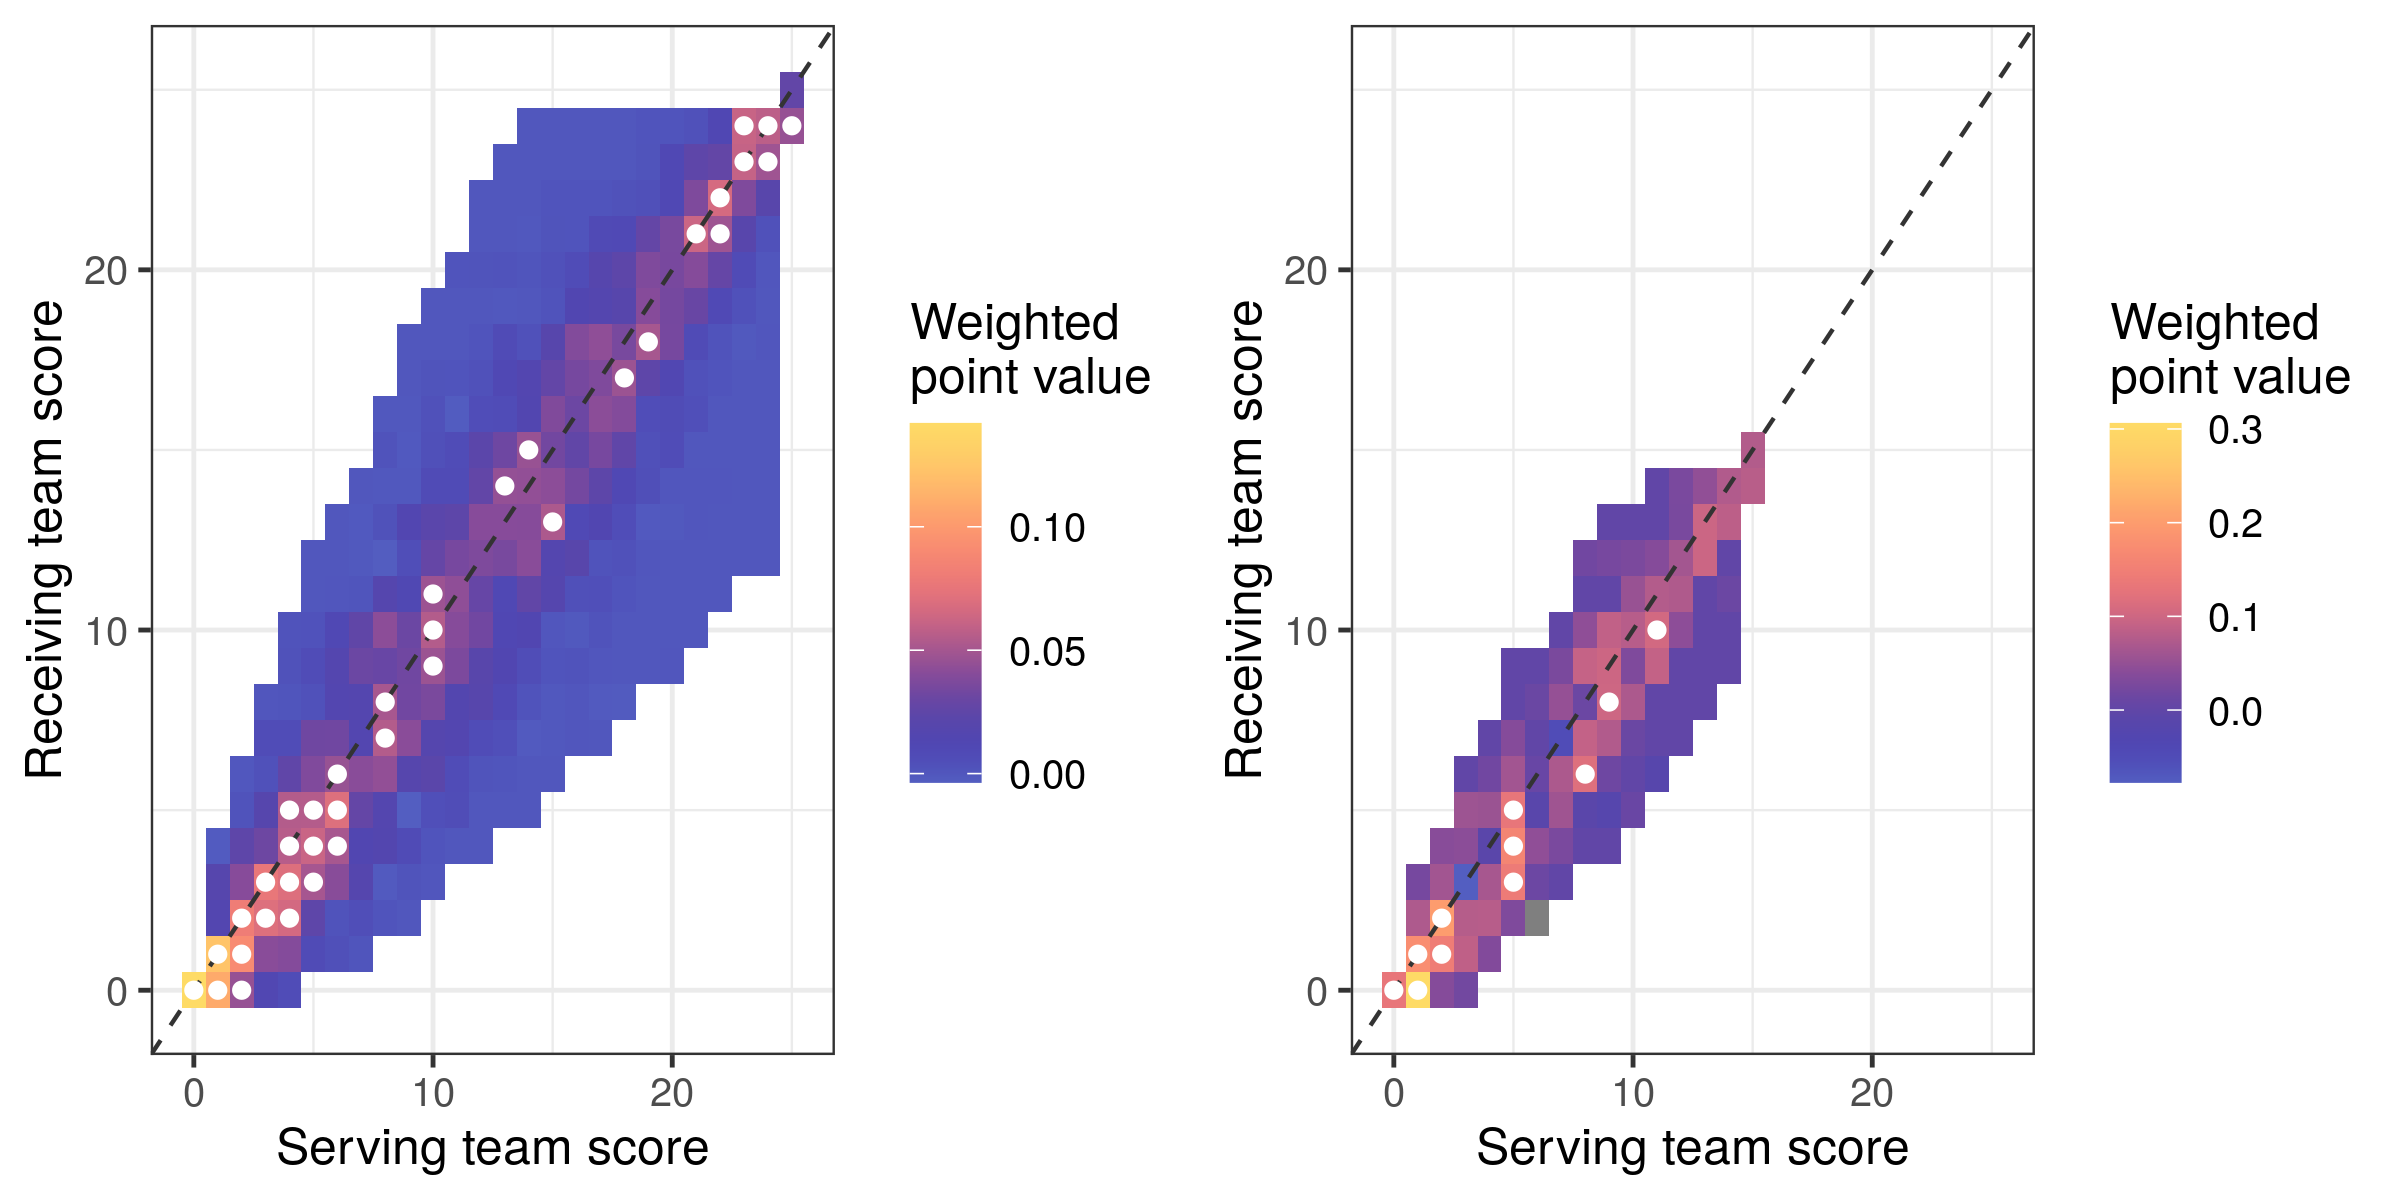
Under this viewpoint, the early (first six or so points) and late (21+) parts of sets 1–4, and the first third of set 5 (scores up to 5) are the most valuable.
Timeouts
As a final thought, the figure below shows the pattern of timeouts called in this league. Colours show the probability of the receiving team calling a timeout (we have used a different colour palette to emphasize that these are showing a different thing to the plots above). The white dots show the top 10% most valuable points from the previous plot (weighted point value).
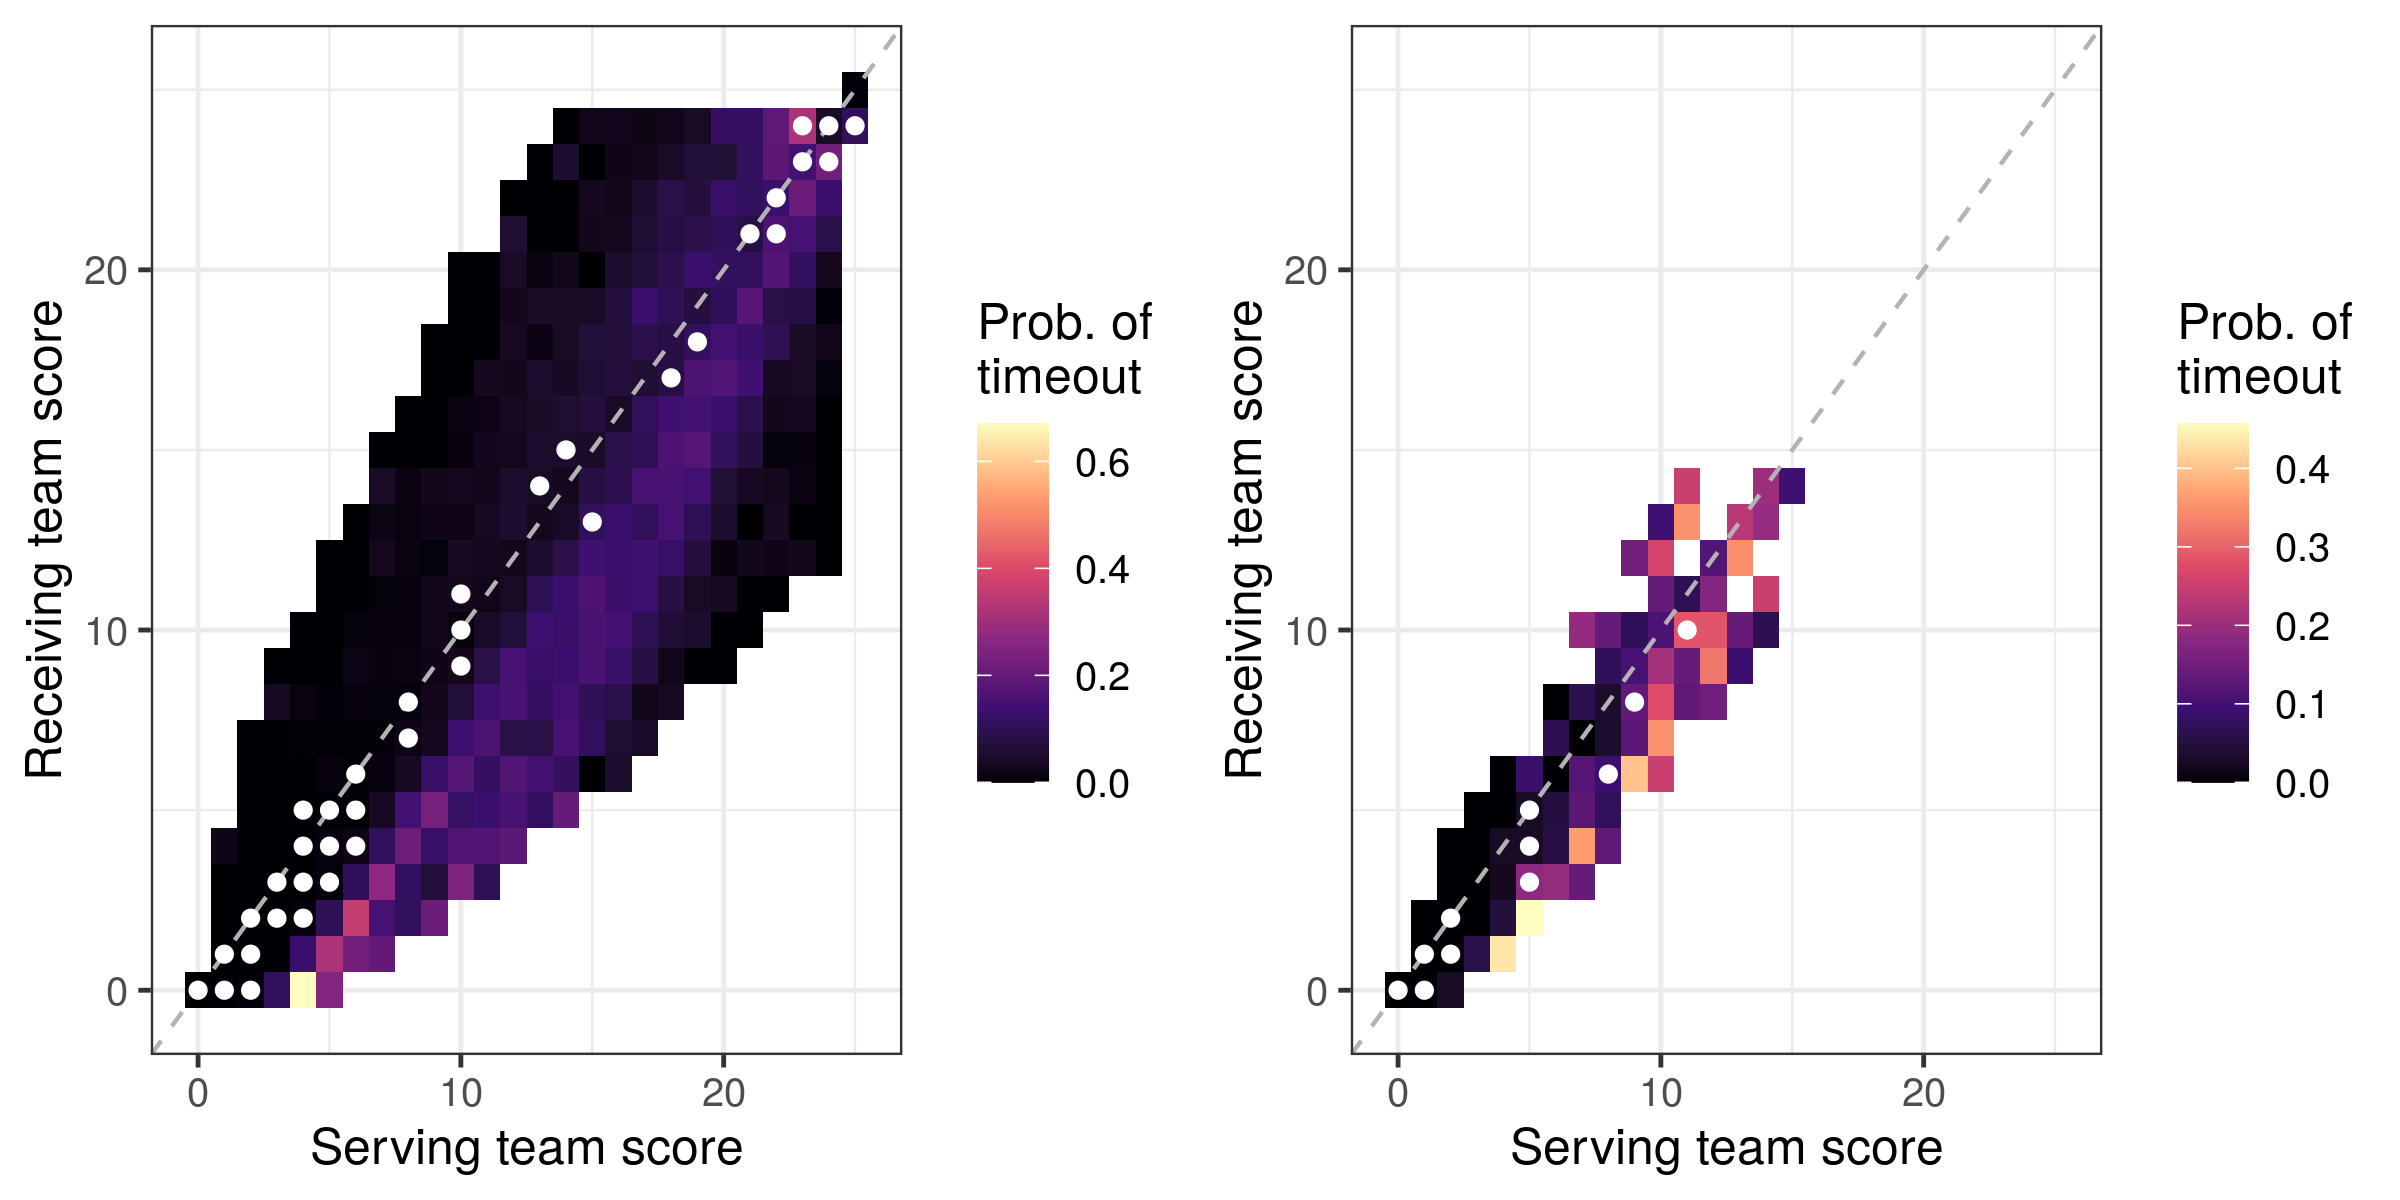
Timeouts are overwhelmingly called when the receiving team is trailing, as you would expect. In the early stages of sets, timeouts appear to be called a few points after the most valuable points have passed (the purple-yellow colours lie to the right of the white dots: the serving team scores a few more points after the most valuable point has passed, before the timeout gets called).