
Serve aggressiveness revisited
2018-07-26
Serve aggressiveness
We have looked previously at serve aggressiveness in volleyball, and reached the conclusion that serve error rate is probably a good indicator of serve aggressiveness. Players with higher error rates are probably serving more aggressively.
Let’s consider the “no-error breakpoint” percentage (i.e. the percentage of points that I win, excluding serves that were errors), as a function of serve error percentage. We might expect to see something like this:
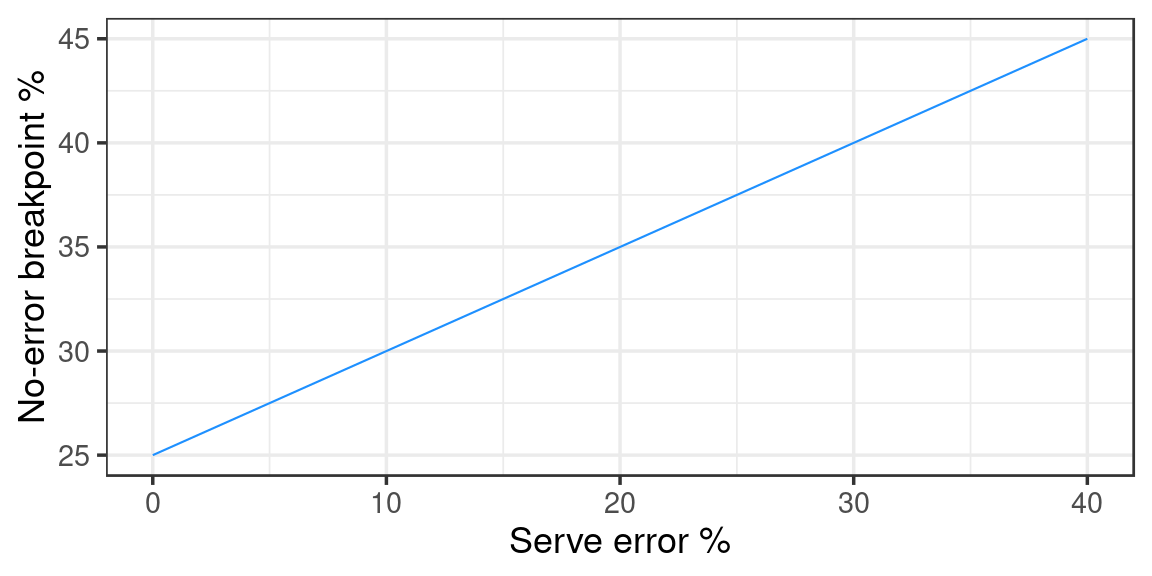
The logic is that if I serve no errors, my breakpoint percentage is low because those serves are not aggressive enough to put pressure on the receiving team. If I ramp up my serve aggressiveness then I am more likely to make service errors, but at the same time any serve that isn’t an error is more likely to lead to a point win because of the increased pressure on the receiving team. (A strictly linear relationship, as shown above, may not be realistic but is sufficient for the purposes of illustration.)
What does that mean for my overall breakpoint percentage in terms of serve errors?
My overall breakpoint percentage in this scenario is then just my no-error breakpoint percentage multiplied by the fraction of serves that are not errors:
Breakpoint = NoErrorBreakpoint * (1 - ServeError/100)
In the example graph above, the no-error breakpoint percentage is a linear function of serve error percentage, which we can write as:
NoErrorBreakpoint = a*ServeError + b
And combining those two equations gives:
Breakpoint = b + (a - b/100)*ServeError - (a/100)*ServeError^2
So the overall breakpoint percentage is a quadratic function of serve error percentage. From your high school maths you will remember that this quadratic function is an upside-down U-shape, which means that there is a particular serve error percentage that maximizes my overall breakpoint percentage.
For our example it looks like this:
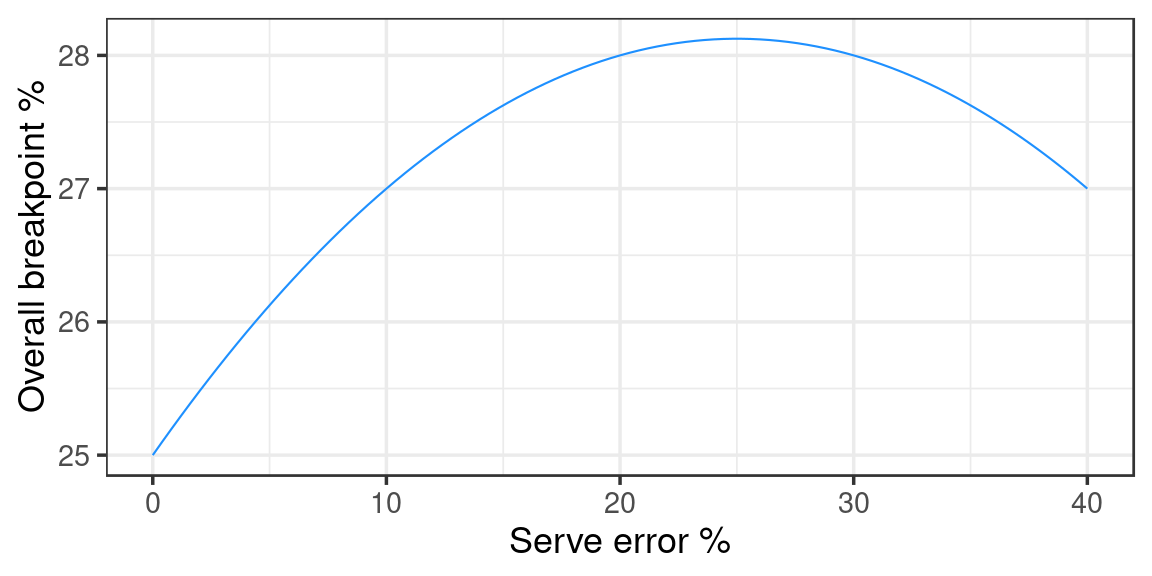
That is, my overall breakpoint percentage is highest at a serve error percentage of 25%. The losses that I incur by serving this many errors are compensated for, because I win more points on the serves that aren’t errors.
What if my no-error breakpoint percentage didn’t increase very much with increased serve error percentage? The optimum point would change: as my serve error rate increases I lose points from those errors, but I don’t get as strong an increase in point win rate on the serves that aren’t errors. Thus we would expect my overall breakpoint percentage to be optimized at a lower serve error percentage. And this is indeed the case:
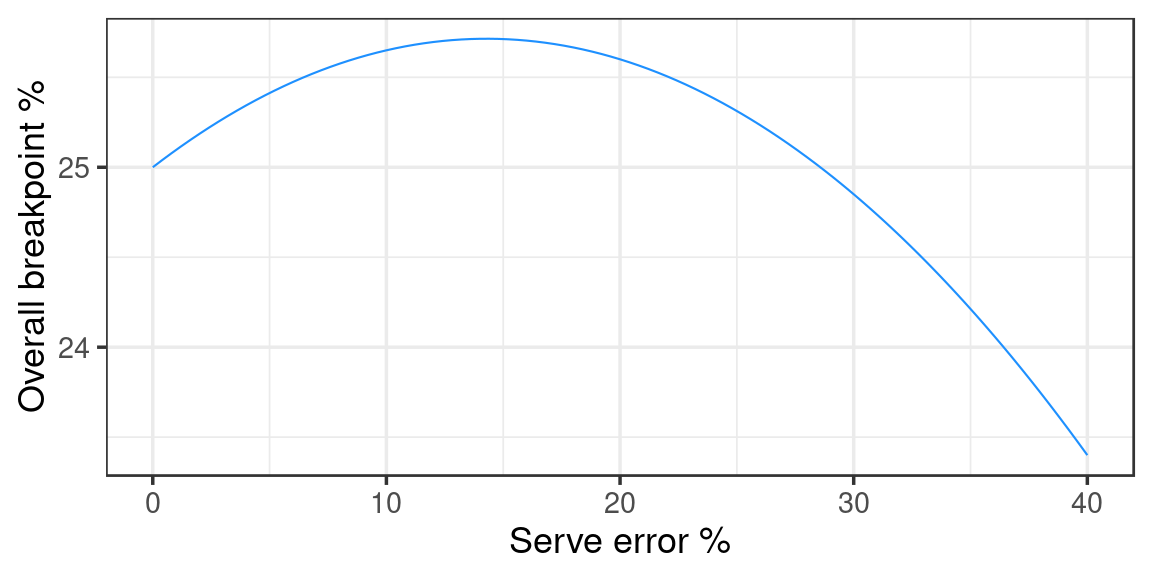
Here my overall breakpoint percentage is highest at a serve error percentage of 14.3%.
So the optimal serve error percentage is determined by the relationship between serve error percentage and no-error breakpoint percentage, and it seems likely that this relationship will vary depending on the serving and receiving teams.
Applied to real data
That’s all well and good, but does it tell us anything about real-world volleyball?
We demonstrate the idea using data from the preliminary round of the men’s 2018 Volleyball Nations League. In the preliminary round there were 120 matches in total between 16 teams, with every team playing every other team once.
The statistical method is still under development, but some preliminary results are shown below.
First we calculate the serve error percentage for each player, and for every team we tabulate their sideout percentage against each serving player. We then fit a model of each team’s sideout percentage over different serve error percentages (i.e. the equivalent of the top graph, above). For the stats-curious reader, we do this using a generalized additive model that uses a smooth term to model the dependence on serve error rate. This means that the error/breakpoint relationship is not constrained to be strictly linear, and so the resulting overall-breakpoint curves might not necessarily be quadratic.
France vs Korea
For France (who finished the preliminary round on top of the table) against Korea (who finished last) the no-error breakpoint vs serve error graph looks like this:

This graph is exactly as we expected: as France’s serve error rate increases, they are more likely to win points on the serves that are not errors.
The overall breakpoint curves for each team are:
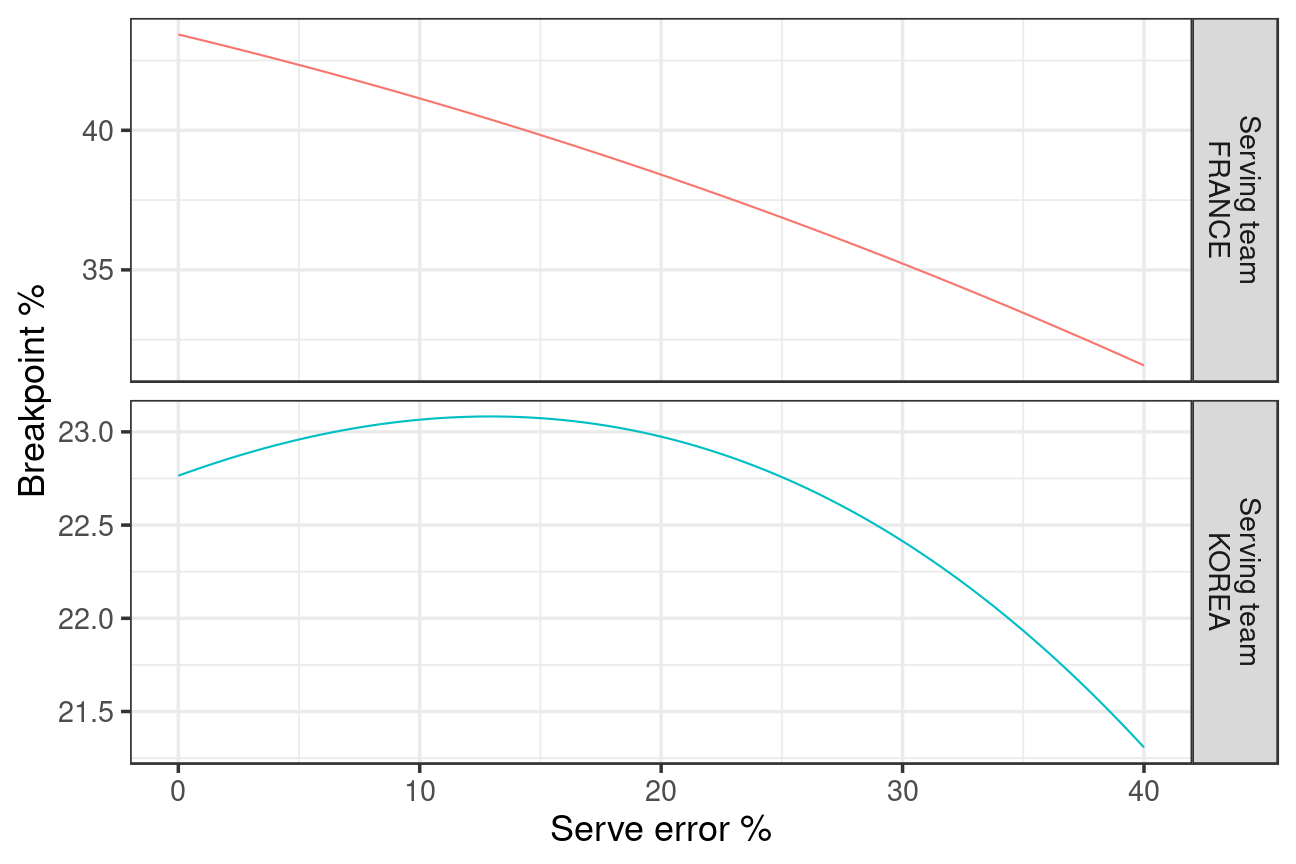
France’s best serving strategy against Korea is to make as few service errors as possible. One possible explanation for this might be if Korea’s attack is weak compared to France’s block/defence, in which case there would be no particular disadvantage to France in serving less aggressively. Korea, in contrast, needs to serve a little more aggressively (serve error percentage around 13%), perhaps in order to put pressure on the French reception attack. Note, though, that Korea’s breakpoint percentage only varies by a couple of percent over the serve error range, and is always less than France’s, so in one sense it doesn’t really matter much what Korea does serve error wise here. And similarly, because France’s breakpoint rate is always higher than Korea’s, it doesn’t really matter if they are not optimal. (For reference, France won this match 3:0, and both teams served around 21% errors.)
Poland vs USA
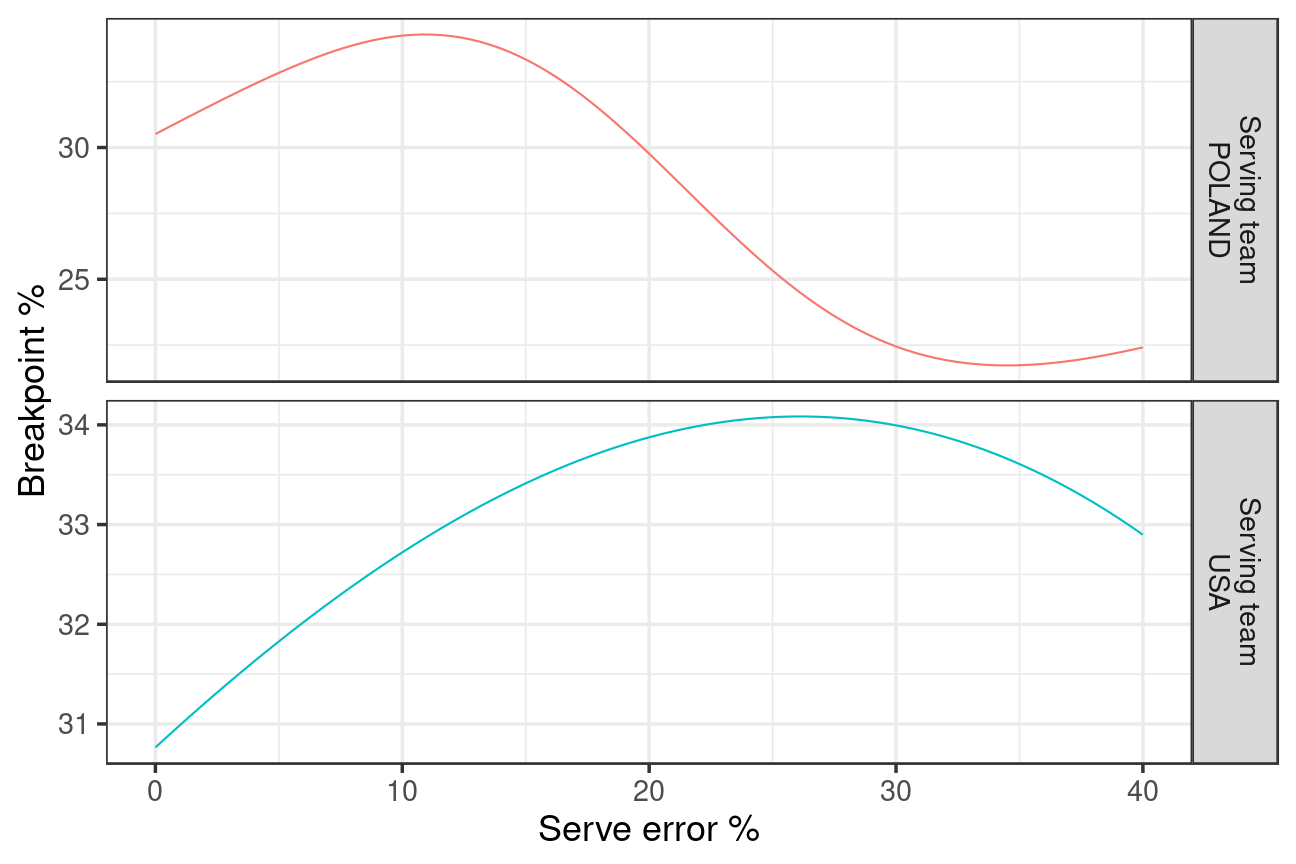
Here Poland’s optimal serve error percentage is fairly low, around 11%, whereas the USA’s is considerably higher (26%). The USA won this match 3:0, with the USA serving 23% errors and Poland 20%. Perhaps Poland might have done better with a lower serve error rate?