
Should you care about aces or block kills?
2019-07-11
Serve aces and block kills are often used as indicators of player performance — for example, the FIVB defines top blockers and servers in terms of kill blocks per set and aces per set. However, aces and block kills are relatively infrequent events. Top ace servers (in international men’s competition) have an ace rate up to about 15%. Block kill rates are even lower at less than 10%.
The occurrence rate of infrequent events can be difficult to estimate reliably, because by definition there aren’t many of them. Luck or other factors that add or subtract one or two events every now and again can have a large effect on the overall total. Looking at the rate of such events might therefore not be a particularly reliable way of assessing serve or block performance1. Indeed, various analyses have shown that e.g. ace percentage is not a good predictor of break point percentage.
We can demonstrate the problem by simulation:
- Choose a random “serve strength” value between 0.1 and 0.9. We use this number as the probability that the serving team will win a given point.
- Define the ace rate as
(serve strength)/10(that is, the probability of serving an ace is one-tenth the probability of the serving team winning the point. This means that, on average, 10% of points won by the serving team will be won by aces). - Simulate 100 serves, with the number of points won and number of aces determined by their associated probabilities (these are simulated as binomial random variables).
- Repeat many times with different random serve strength values.
First let’s plot serve strength against total points won:
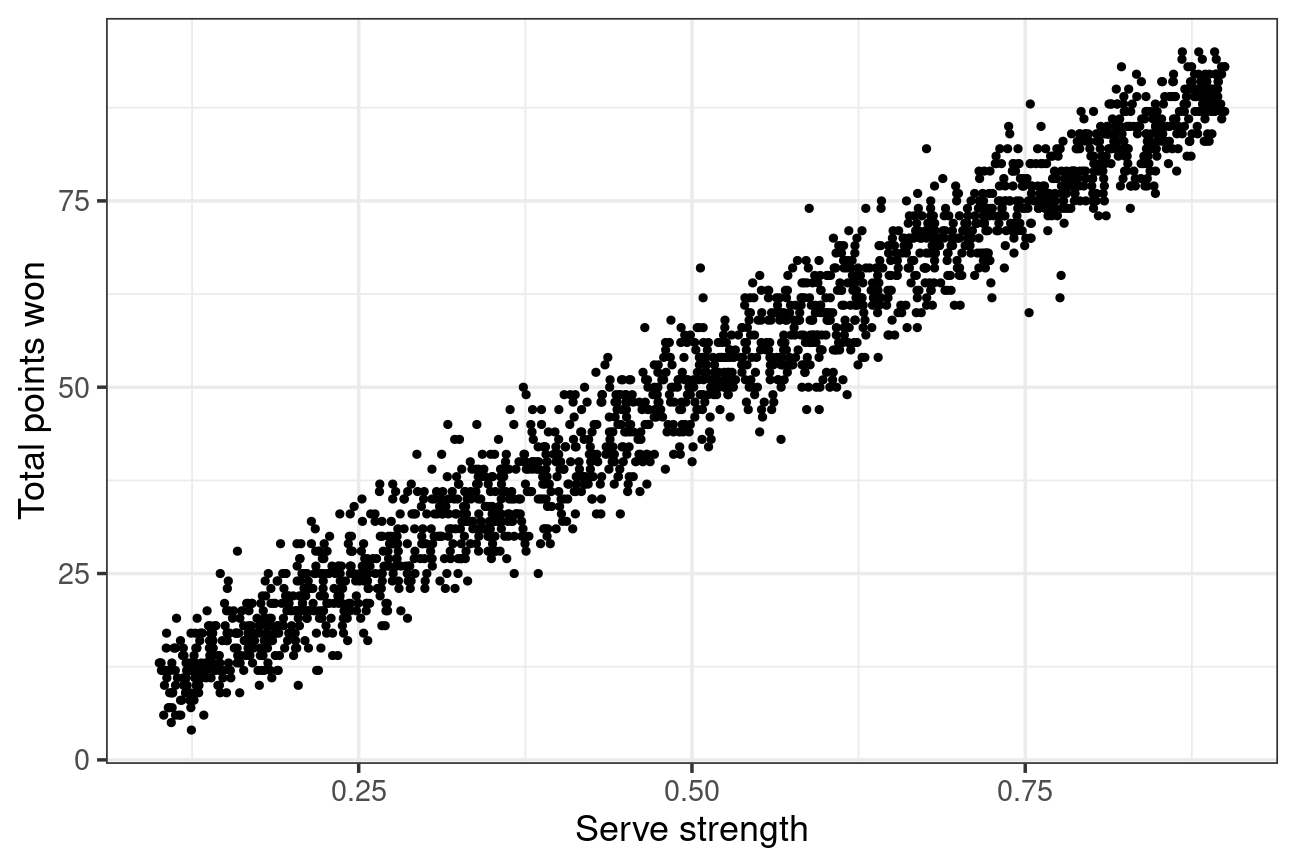
As you’d expect, the relationship is fairly tight. There is some spread, because we are dealing with probabilities. For a serve strength of 0.5, we see between 40 and 66 points won. A serve strength of 0.5 means that the serving team has a 50% chance of winning any given point. This is equivalent to tossing a coin — and if you tossed a coin 100 times, you don’t expect to always get exactly 50 heads.
Now let’s look at what happens if we use the number of aces as an indicator of serve performance — we plot serve strength against number of aces (the points have been jittered slightly along the x-axis to reduce overplotting):
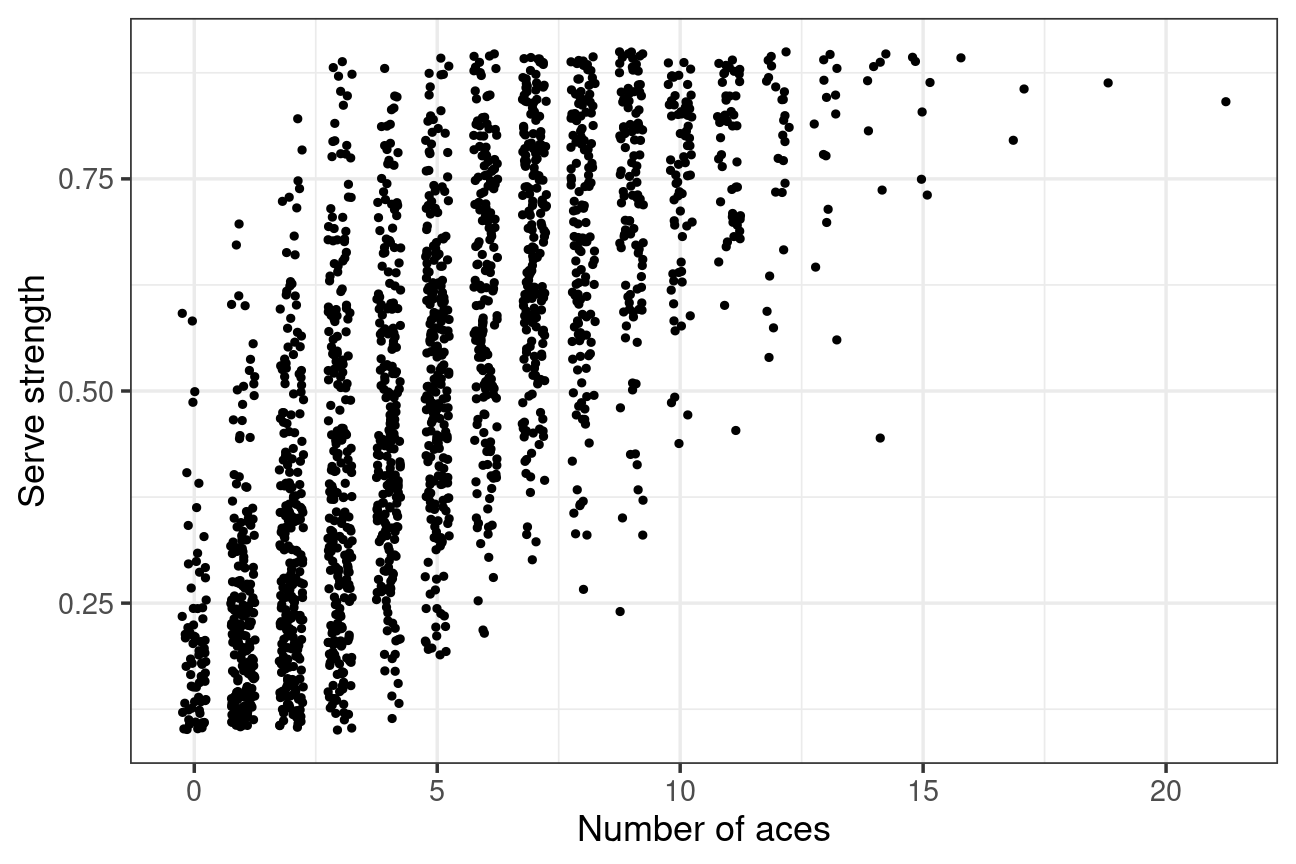
If the number of aces was a good indicator of serve strength, then we would expect this graph to show a close relationship between the two. However, the relationship is much looser. A higher number of aces does broadly correspond to an increase in serve strength, but there is a lot of spread. Consequently, the number of aces is a poor predictor of serve strength.
Teams scoring 5 aces had a serve strength anywhere between 0.19 and 0.89. Even scoring 12 aces (which only occurred in 1.2% of simulations and should therefore correspond to only the very best servers) occurred with serve strengths between 0.54 and 0.9. A team scoring no aces at all could have had a serve strength as high as 0.59.
Conclusion
If you are specifically interested in serve aces or block kills as statistics in their own right, then by all means look at them. But it is probably not a good idea to rely solely on relatively infrequent events such as serve aces or block kills as indicators of more general serve or blocking performance.
There are of course other reasons why aces and block kills might not tell the whole story about performance. It isn’t difficult to imagine, for example, that a blocker could have an influence on a match without getting a single block kill (or for that matter even touching the ball at all). But here we’ll focus on the relative rarity of these events and what that means for their use as performance indicators.↩