Jumping in volleyball matches
2018-08-21
Mark Lebedew, Francesco Oleni.
Monitoring an athlete’s training load is important for performance and fatigue management. Jumping is a major part of volleyball, and many injuries are jumping-related. Monitoring jumping load is therefore a potentially useful component of load management (although it is not the only consideration).
Jump load can be measured by wearable tags (accelerometers) but we can also estimate competition jump load from scouted match data, based on the number of serves, attacks, blocks, and jump sets an athlete performs.
Here we present a brief summary of the jump stats from the 2018 Men’s Volleyball Nations League competition. Only matches from the preliminary round have been used, since all teams played the same number of matches in this round.
How jumps are estimated
Jumps are counted with weightings that follow the defaults given in the app:
jump serves, and outside/opposite attacks (front or back row): one full jump per attempt (weighting = 1.0)
passes/digs rated as “perfect” (#) or “good” (+): 1.0 for the middle attacker
passes/digs rated as “OK” (!): 0.5 for the middle attacker (you can intepret this as one full jump for every two such passes)
jump-float serves: 0.5
setters get 0.7 for each set on a perfect (#) or good (+) pass or dig, and 0.4 for each set on an “OK” (!) one
each opposition attack: 1.0 for the front-row middle blocker (the middle blocker is assumed to attempt to block every attack)
each opposition attack from the left or right side (front or back row): 1.0 for the associated wing blocker (i.e. the player blocking in position 2 for left-side attacks, or 4 for right-side attacks)
each opposition pipe attack: 0.3 for each of the wing blockers.
The weights represent both jump rate and jump intensity: the 0.5 associated with a jump-float serve is an intensity weighting (every such serve involves a jump, but not at maximal intensity) whereas the 0.3 associated with wing pipe blocks is a jump rate (wing blockers participate in the block on about 30% of pipe attacks).
Results
Summary by position
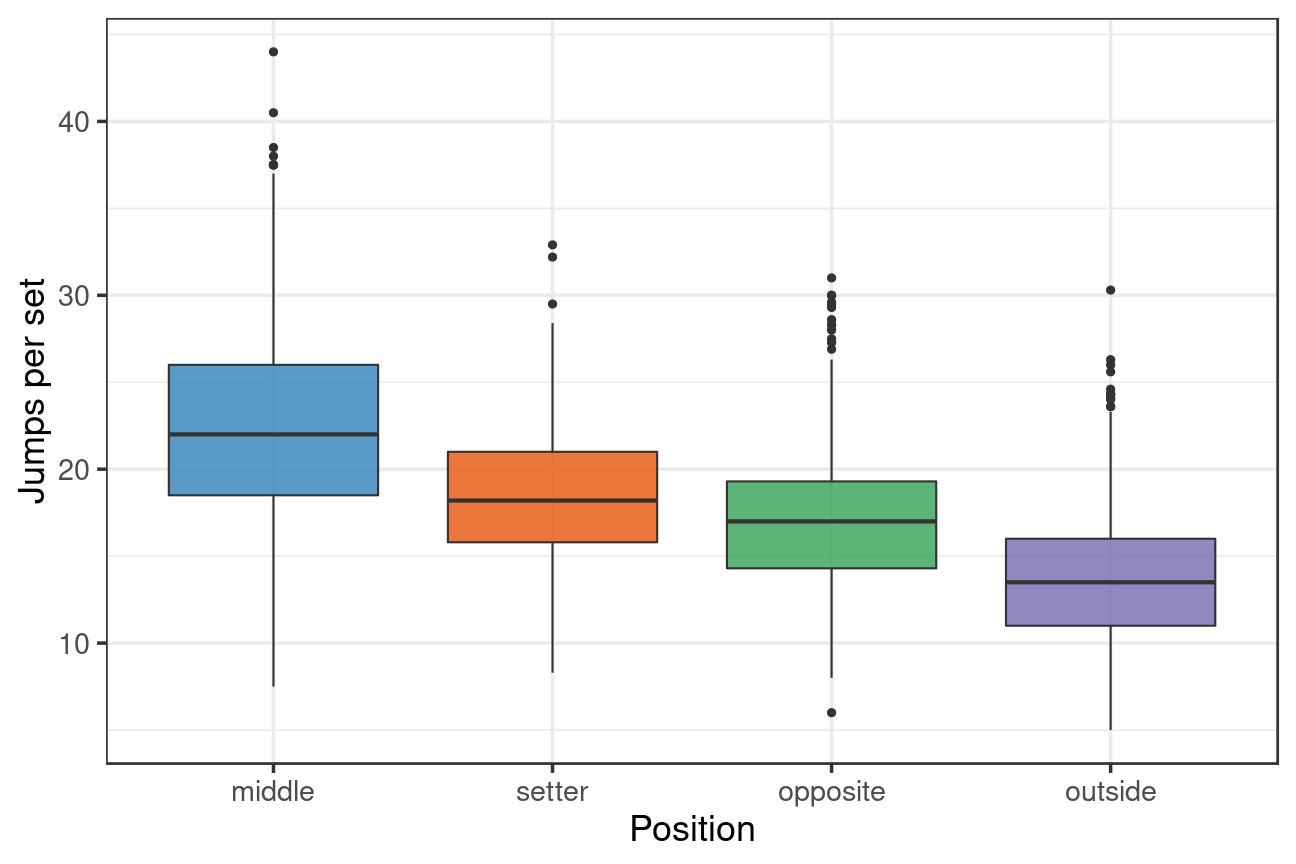
We first calculate the number of jumps per set for each position. These calculations are based on data in which players were on court for entire sets (i.e. not substituted off), and only from sets 1–4 (which are played to 25 points, whereas the 5th set is to 15 points). We don’t need to keep track of middles swapping with liberos for our calculations.

Middle blockers had the highest jump count (mean 22.2 jumps per set, interquartile range 18.5–26), followed by setters (18.4, interquartile range 15.8–21), opposites (17.2, interquartile range 14.3–19.3), and outside hitters (13.8, interquartile range 11–16).
Busiest players
Overall: Middles dominate the table, both in terms of the total number of jumps and the number of jumps per set played. Argentina’s Agustín Loser clocked the highest total number of jumps (over 1400) during the competition, and also had the second-highest number of jumps per set played (25.1). Jakub Kochanowski (Poland) had the highest number of jumps per set (25.9) but spent less time on court (30 sets played, compared to 57 for Loser) and so his total number of jumps was considerably lower at 777.
Players in other positions with the highest number of jumps per set played (only including players who played at least 5 matches):
Opposites: Carroll (Australia, 18.5), Zaytsev (Italy, 18.0), Williams (Australia, 17.1), Jiang (China, 16.9)
Outside hitters: Ngapeth (France, 16.3), Poglajen (Argentina, 14.8), Juantorena (Italy, 14.2), Russell (USA, 14.0)
Setters: Cavanna (Argentina, 18.4), Toniutti (France, 17.7), Giannelli (Italy, 17.6), Sanders (Canada, 17.3). Cavanna made by far the highest number of jump-set jumps in the competition (656), followed by Marouf (Iran, 595). Gianelli and Kobzar (Russia) made fewer jump sets (378 and 399) but mostly jump-served, in contrast to many of the other setters, thus raising their number of jumps.
Summary
The estimates obtained from this approach are dependent on the weightings chosen for the various positions and scenarios, as described above. Nevertheless, the results are comparable to published results (e.g. Skazalski et al. 2018) and to our own anecdotal observations. Additional data (e.g. from wearable tags) might help refine the weightings to improve the overall estimates.
