Attack evenness across leagues
2024-09-19
Ben Raymond, Adrien Ickowicz, Mark Lebedew, Michael Mattes, Lauren Bertolacci, Lionel Bonnaure, Josh Cowan, Bart de Gieter, Willem de Wit, Kacper Duda, Gustavo Gallotti, David Hunt, Heima Keita, Kornel Kilinski, Felipe Lima, Riccardo Lugli, Kiyarash Maleki, Pablo Sánchez Morillas, Jordan Neal, Hugh Nguyen, Mateusz Nykiel, Francesco Oleni, Miguel Rivera Rodriguez, Máximo Torcello, Shinnosuke Uehara, Matthieu van den Broeke, Toine van Kastel, Jason Watson, Ruben Wolochin.
In a previous article we introduced the idea of attack evenness — does a team use its attackers evenly, or do they rely on a small number of attackers for the majority of their attacks? We proposed a measure for this, and showed that in the German (men’s) Bundesliga, higher attack evenness was correlated with higher rally win rate. We were very interested to know if this relationship held true in other competitions.
In this article we look at a much larger collection of 139 data sets drawn from 30 different leagues and tournaments, spanning 2004 to 2024.
Here we refer to a “competition” as one season of a league or one instance of a tournament. Men and women are separated into their own competitions (e.g. the 2021/22 season of the Polish men’s PlusLiga is one “competition”, and is a different competition to the 2022/23 PlusLiga and also different to the women’s 2021/22 TauronLiga). Note that not all data sets are a complete set of matches played in that competition, but many are close to complete and those that are not have been checked to ensure that they provide a reasonably representative sample of matches, and at least half of all matches played.
Details on the methods are given at the end of the article, but in short: we look at attack evenness as well as rally win rate effect, which is the increase in rally win rate associated with an increase in attack evenness. As a guide to interpreting attack evenness values:
a perfectly even attack profile in which every attacker makes an equal number of attacks (relative to their time on court) has an evenness of 1. In practice, values around 0.9 to 0.95 are probably the highest attack evenness that one might reasonably expect to see
a very uneven attack profile in which one of the outside hitters or the opposite makes 100% of attacks has an evenness of 0.25
a less extreme but still uneven attack profile in which one of the outside hitters or the opposite makes 50% of all attacks has an evenness of 0.75.
This is (once again) a long article, so here are the main findings:
rally win rate effect was positive in all but 3 of the 139 competitions examined here. In other words, higher attack evenness was almost always correlated with higher rally win rates
men’s and women’s competitions have very similar attack evenness values in general but with exceptions in particular competitions — e.g. women’s attack evenness at the Olympics was consistently lower than men’s
attack evenness appears to increase with age category
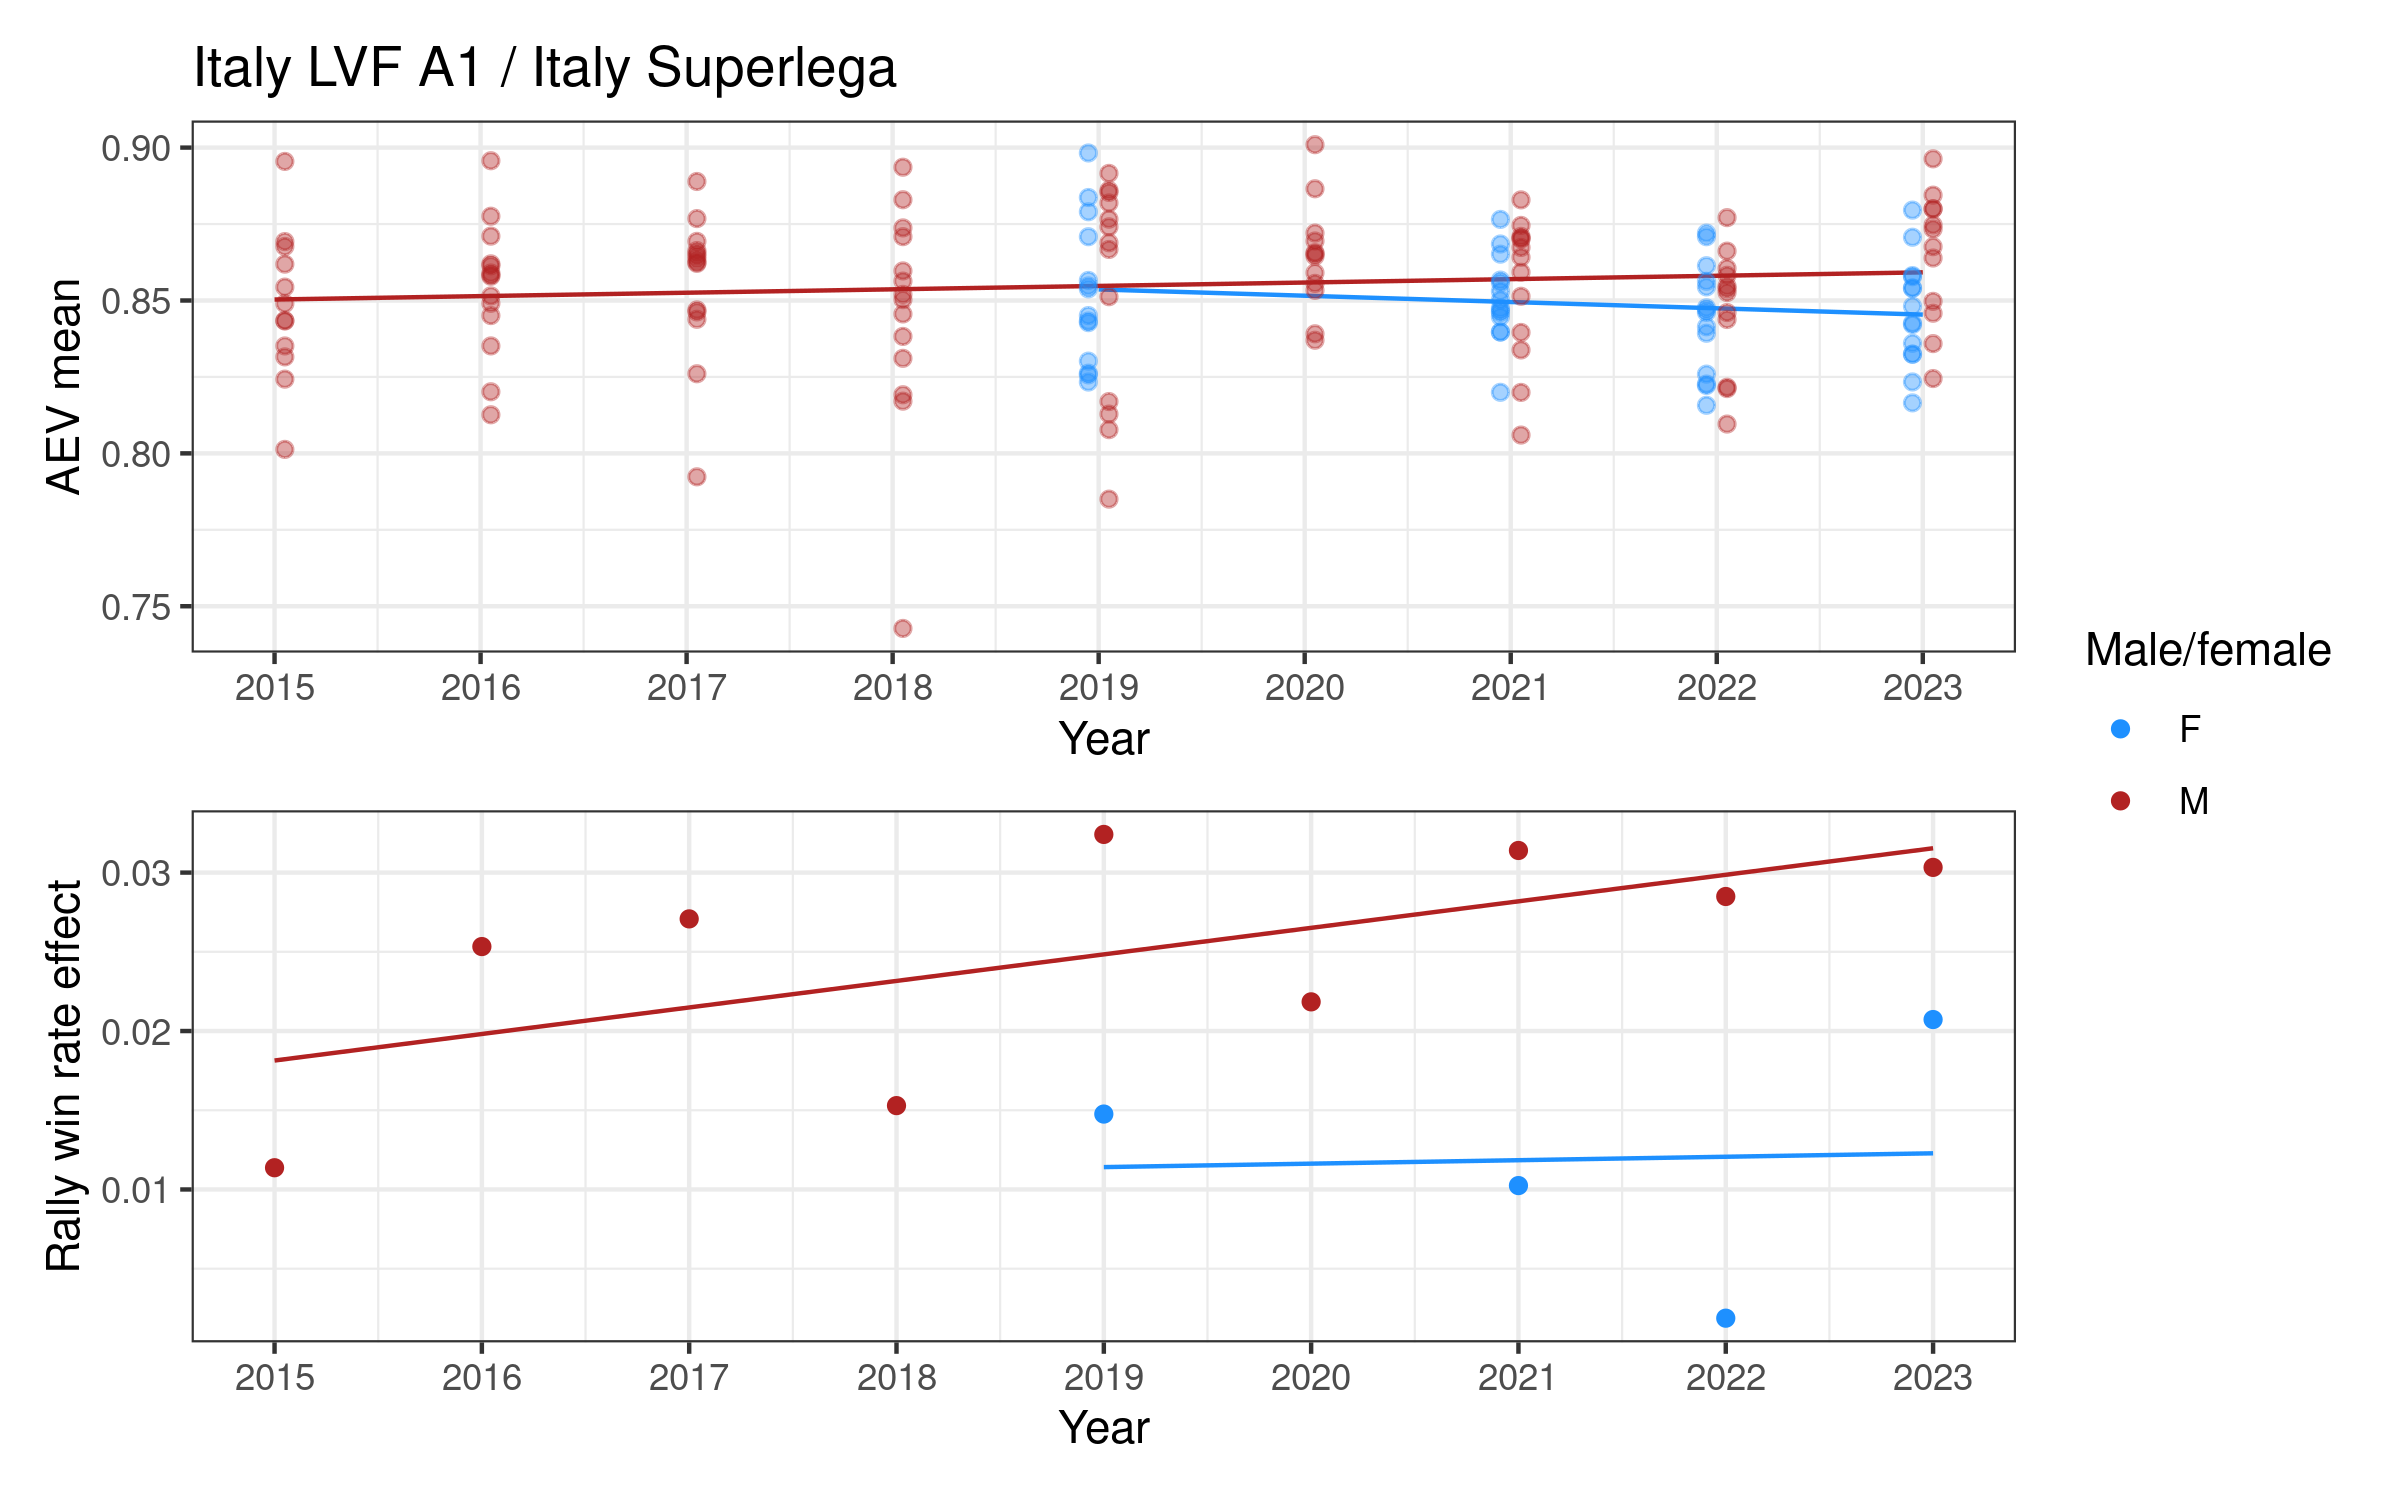
evenness has generally increased over years in men’s competitions, but trends are mixed for women. Some women’s competitions (notably Italy, Netherlands, and Poland) are showing a decrease in attack evenness over time.
Full results are given below.
Attack evenness is essentially a measure of setter distribution and team attack structure, summarized down to a single number. It provides a concise summary that complements other ways of assessing a setter’s distribution, including traditional methods such as setter distribution charts and more advanced approaches such as the Science Untangled setter choice analysis app. Although we do not do so in this article, evenness can be calculated and compared across subsets of data — e.g. by pass quality, setter position (rotation), crunch time vs normal play, sideout vs breakpoint, reception phase vs transition, and more.
For those wanting to look at attack evenness on their own data, it has been incorporated into the Science Untangled volleyball analysis and reporting app, with other apps to follow. Analysts writing their own code can also find it implemented in the ovlytics R package, which is part of the openvolley suite of packages.
Results
The average attack evenness value, the standard deviation (a measure of variability of attack evenness across the different teams in a competition), and the rally win rate effect for each competition is shown in the table below.
The overall distributions of average attack evenness and rally win rate effect per competition look like this:
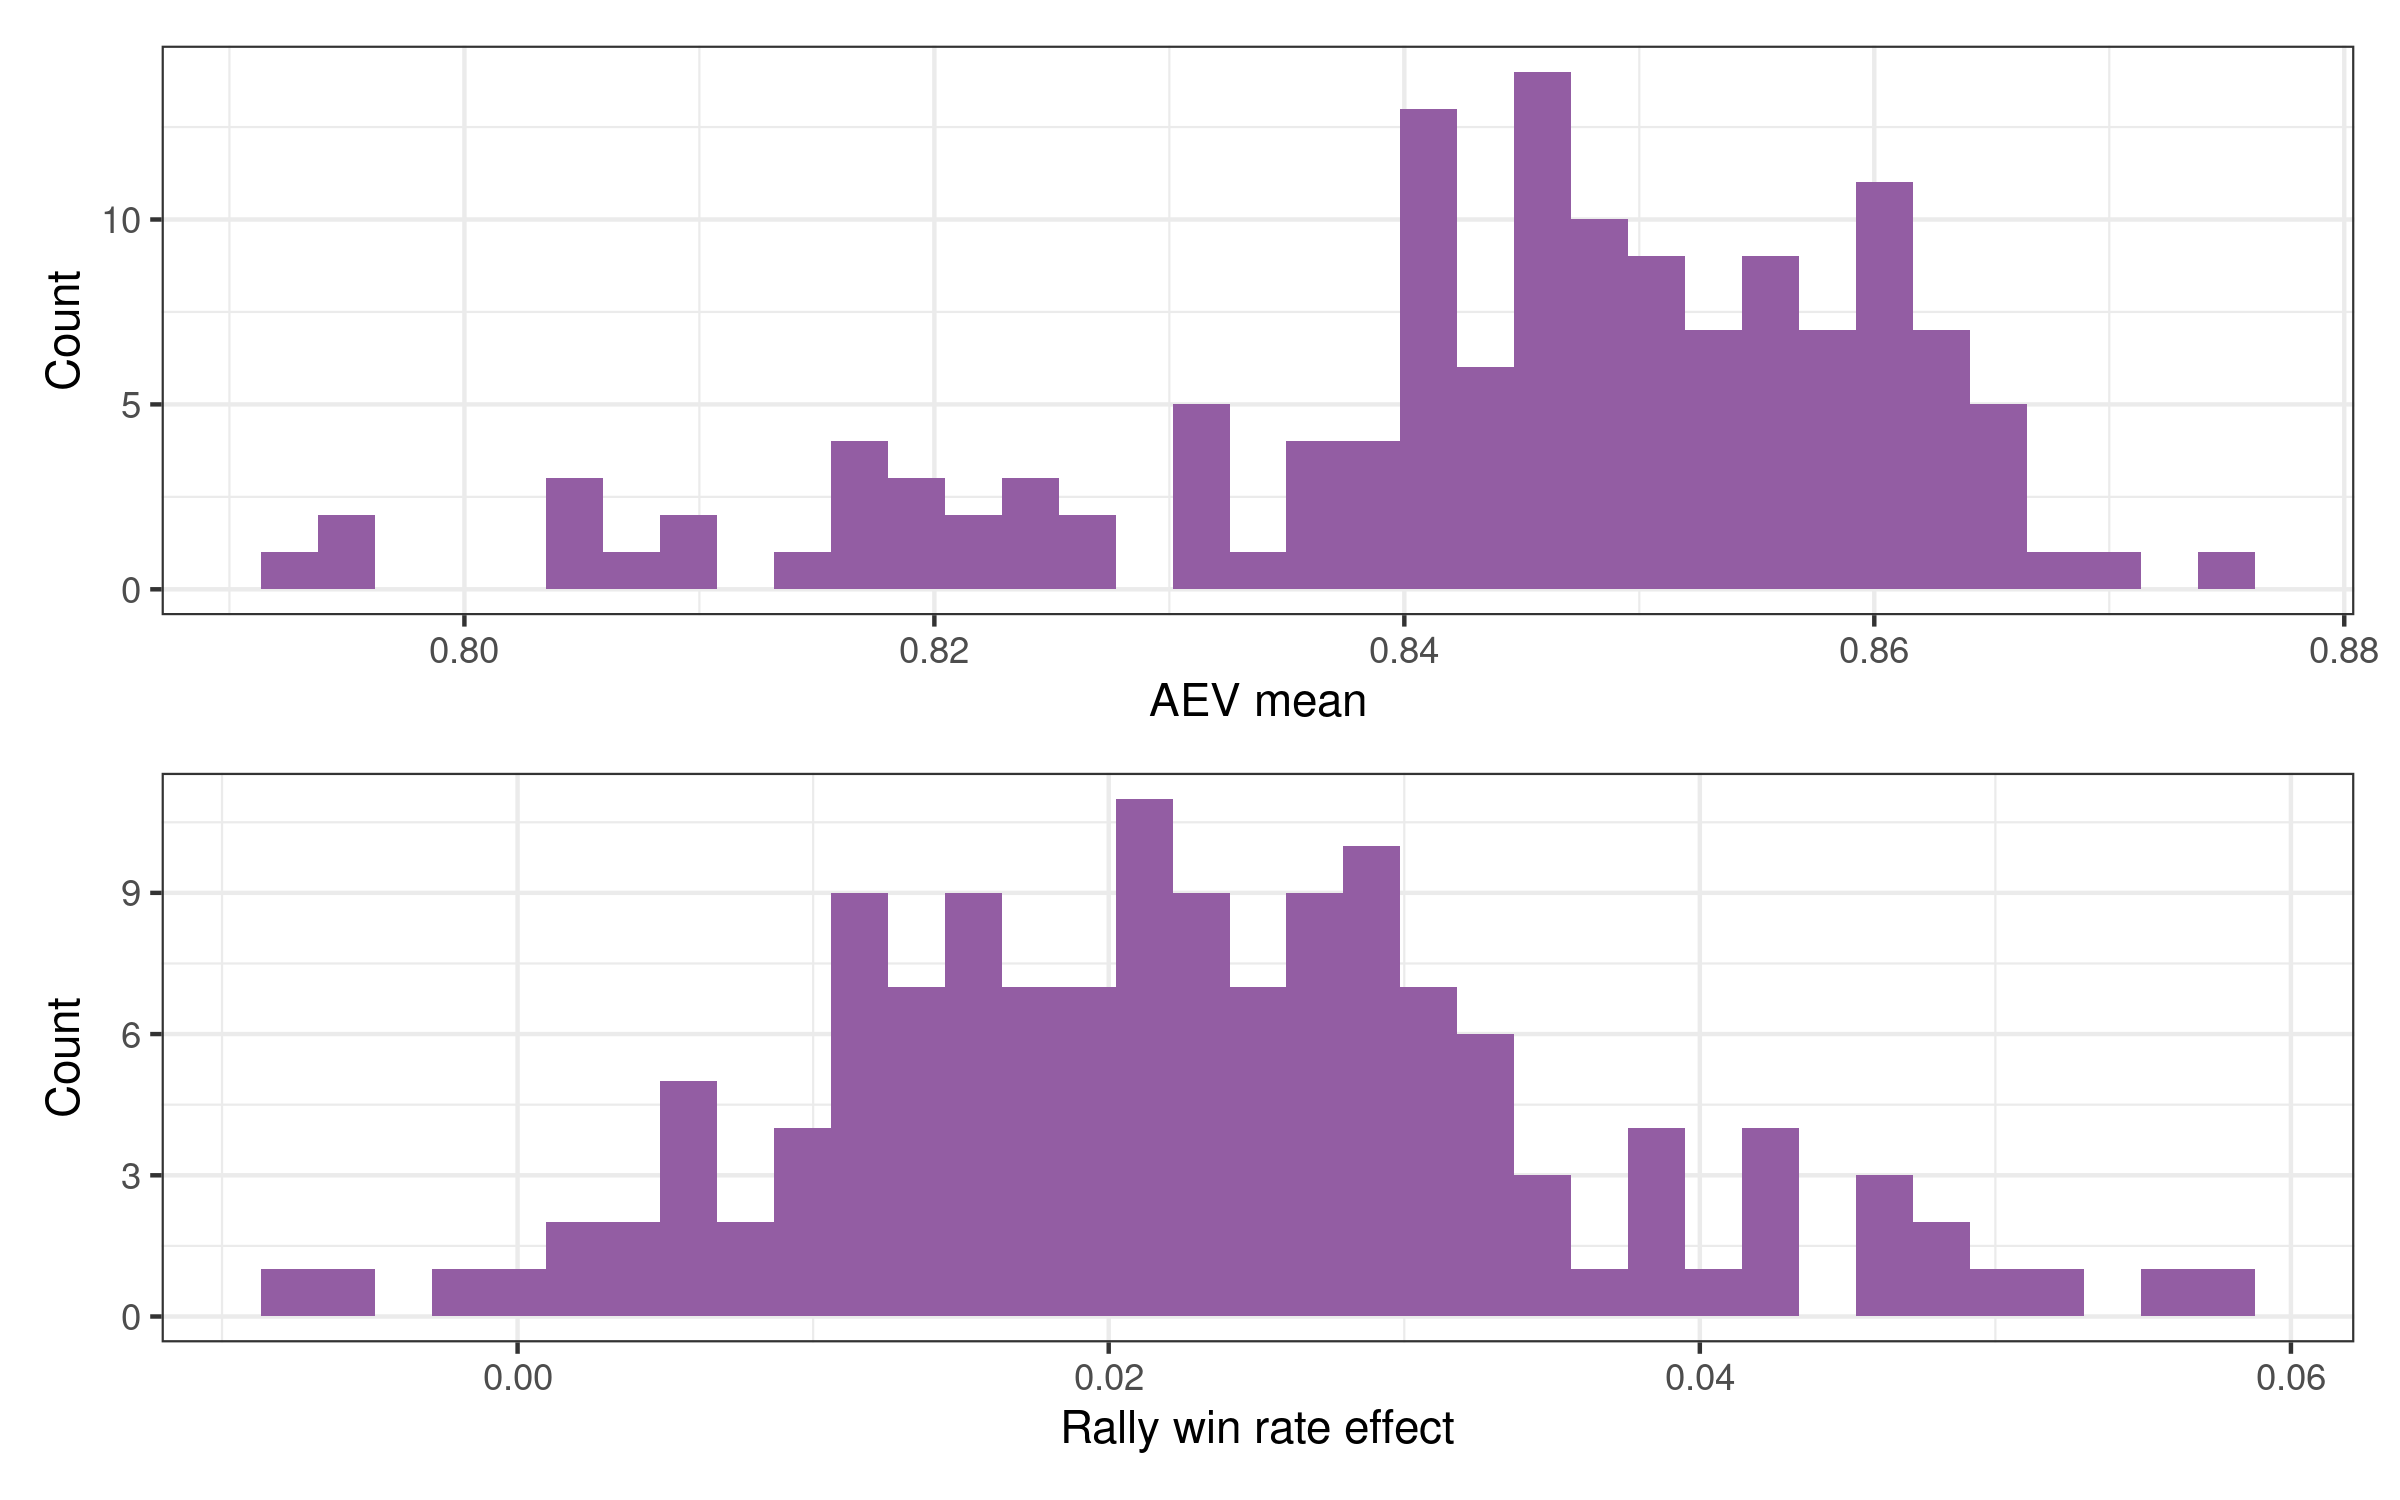
Competition-average attack evenness values ranged from 0.79 to 0.87. For individual teams, 95% of values were within the range 0.77 to 0.89.
More interestingly, perhaps, the rally win rate effect values ranged from -0.009 to 0.057, with a mean value of 0.023. Only 3 competitions out of the 139 examined here had a negative rally win rate effect (and those were only very slightly negative).
That the rally win rate effect is positive in almost every competition is extremely interesting. It does not necessarily mean that every team in every competition won more rallies when they played with higher attack evenness (we are not estimating rally win rate effects for individual teams, only for each competition as a whole — see methods). But it does mean that when aggregated across teams, almost every competition showed an increase in rally win rate with an increase in attack evenness.
Results: Men vs women
Does attack evenness differ between men and women? To make a fair comparison, we select matching competitions on the basis of year and tournament or league (e.g. Olympics men 2016 and Olympics women 2016 are considered to be a match, as are Polish men’s PlusLiga 2022/23 and the women’s TauronLiga 2022/23). We aren’t strictly comparing each member of a matching pair with the other one, but we choose matching pairs so that the men’s and women’s data sets being compared are similar in terms of their time span and competition level.
We had 62 matching data sets to work with for this comparison (i.e. 31 men’s competitions with 31 matching women’s competitions).
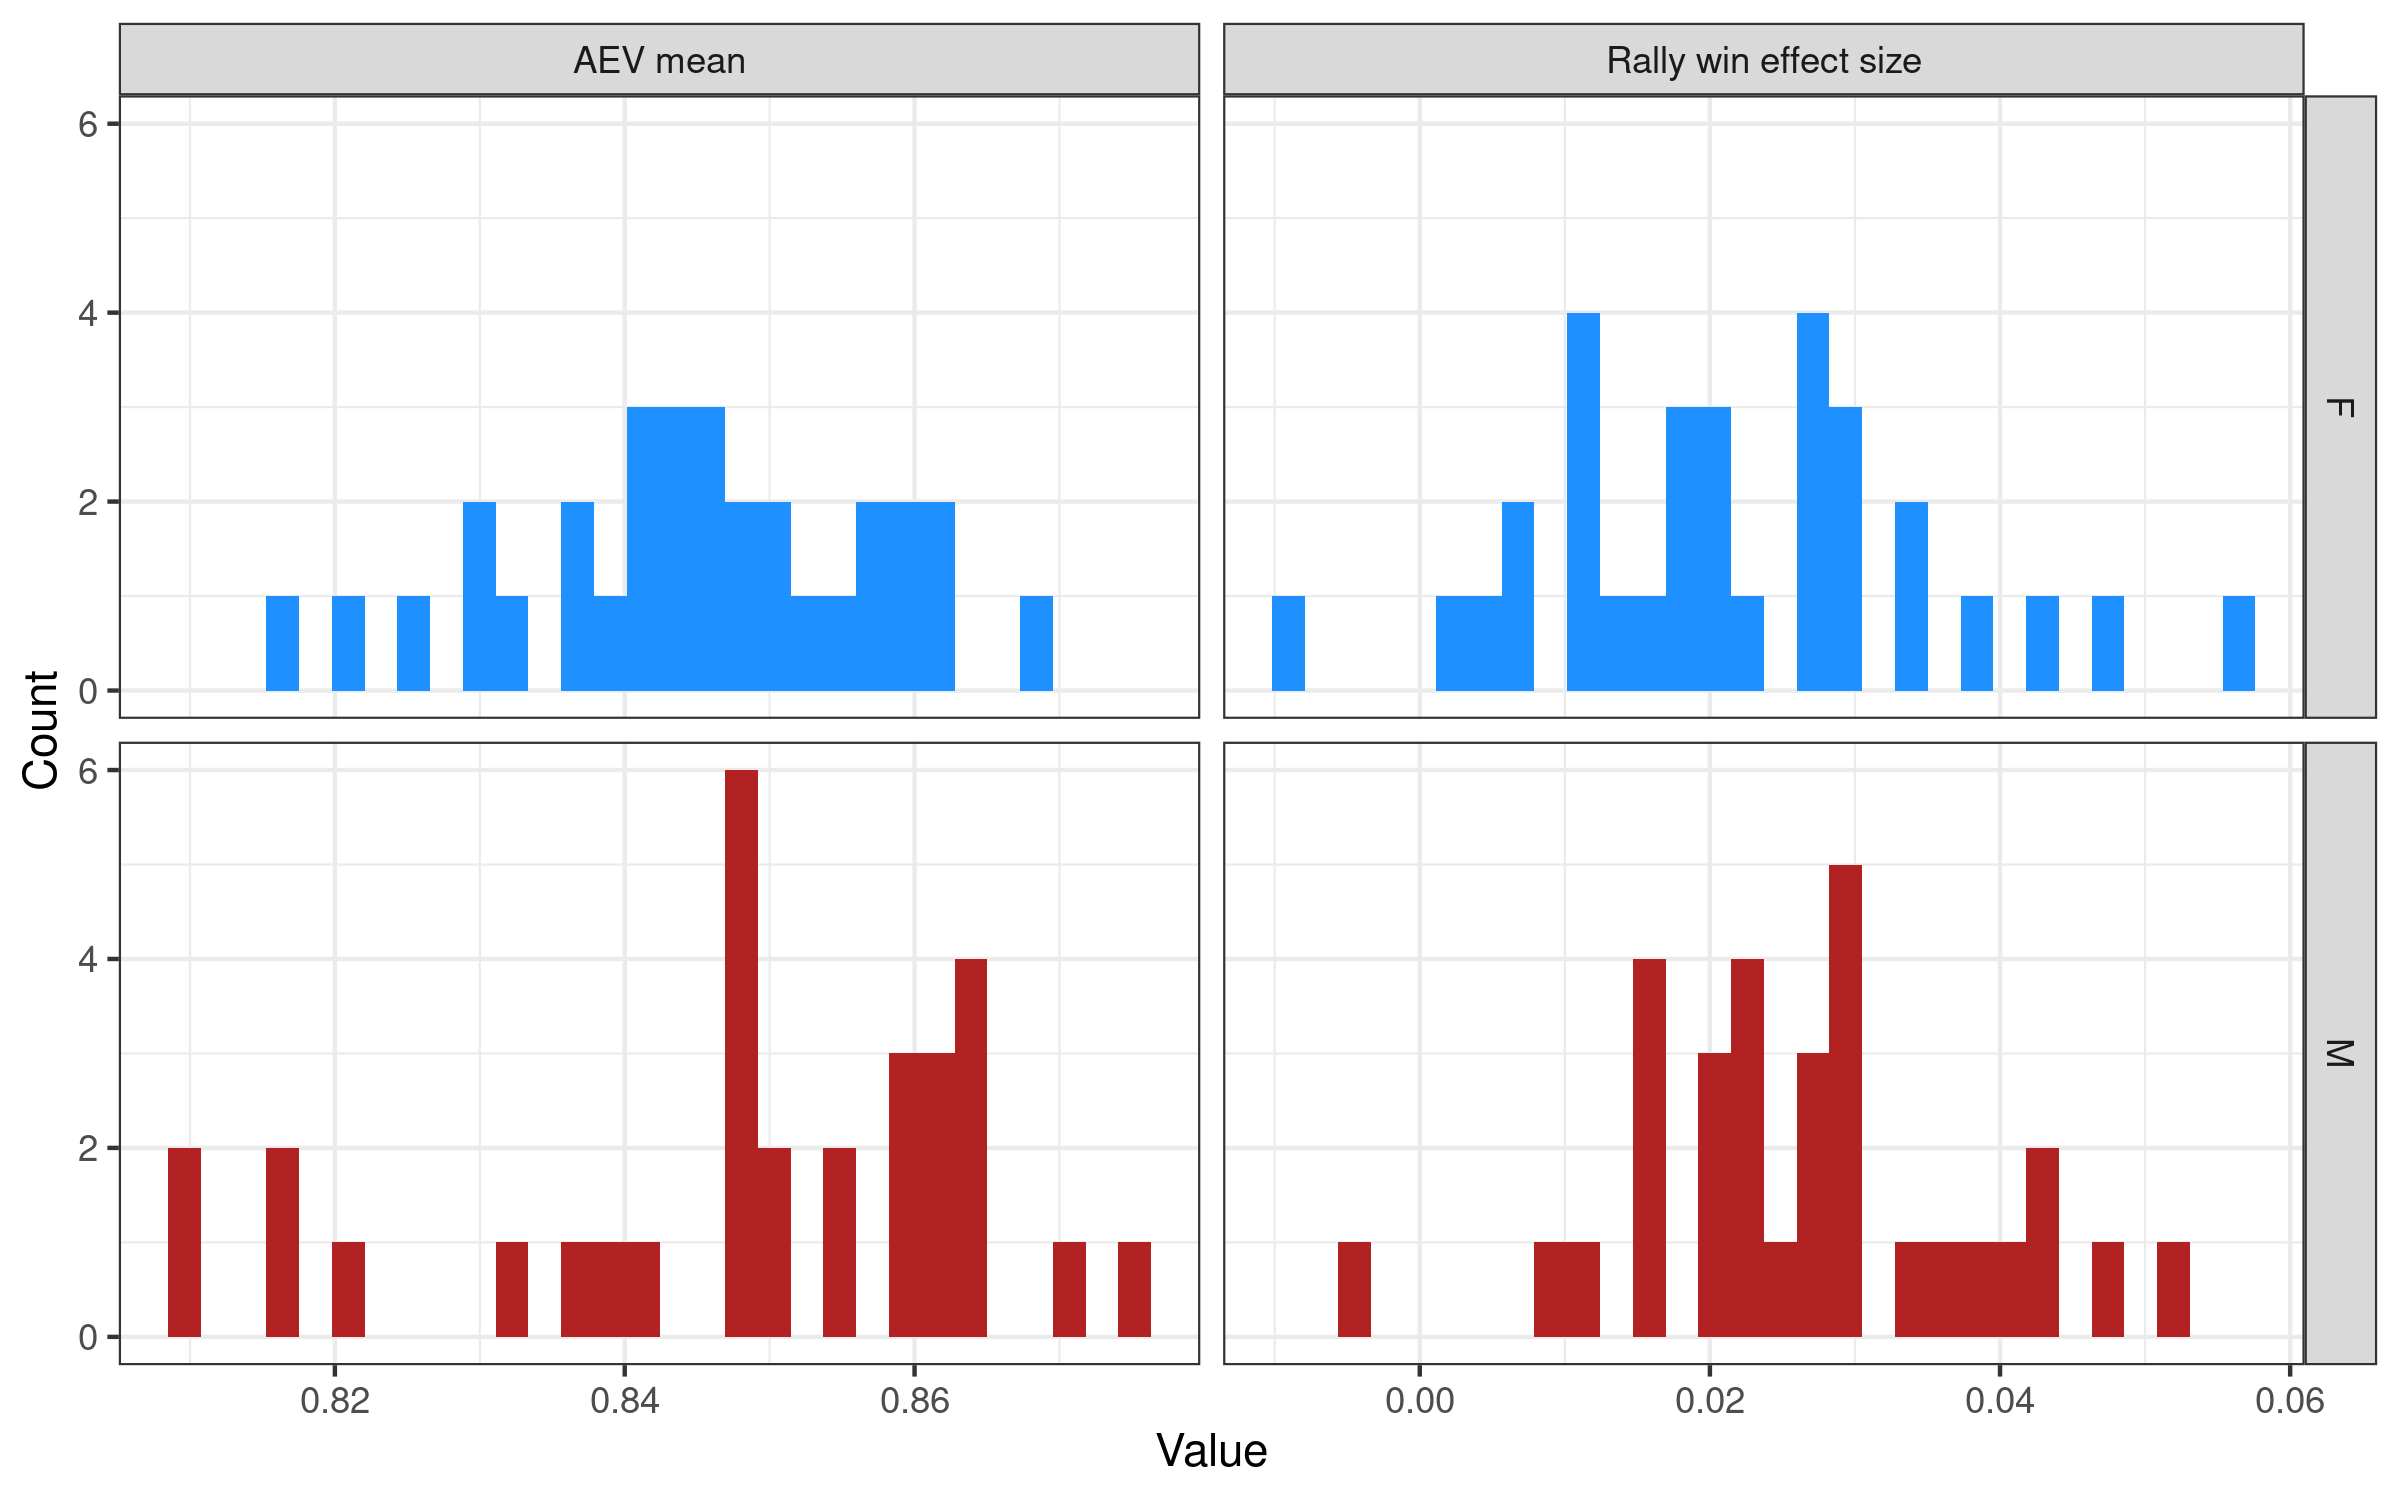
By eye, the distributions of both attack evenness values and rally win rate effects look quite similar between men and women. Formal statistical comparisons revealed very little support for the idea that men’s and women’s competitions differed in either of these two parameters.
Results: Age comparisons
We can also compare across age brackets. Similarly to the male/female comparison, we used a subset of matching data sets: this time the men’s World Championships — U17 (2024), U19 and U21 (each from 2019, 2021, and 2023), and senior men (2018 and 2022).
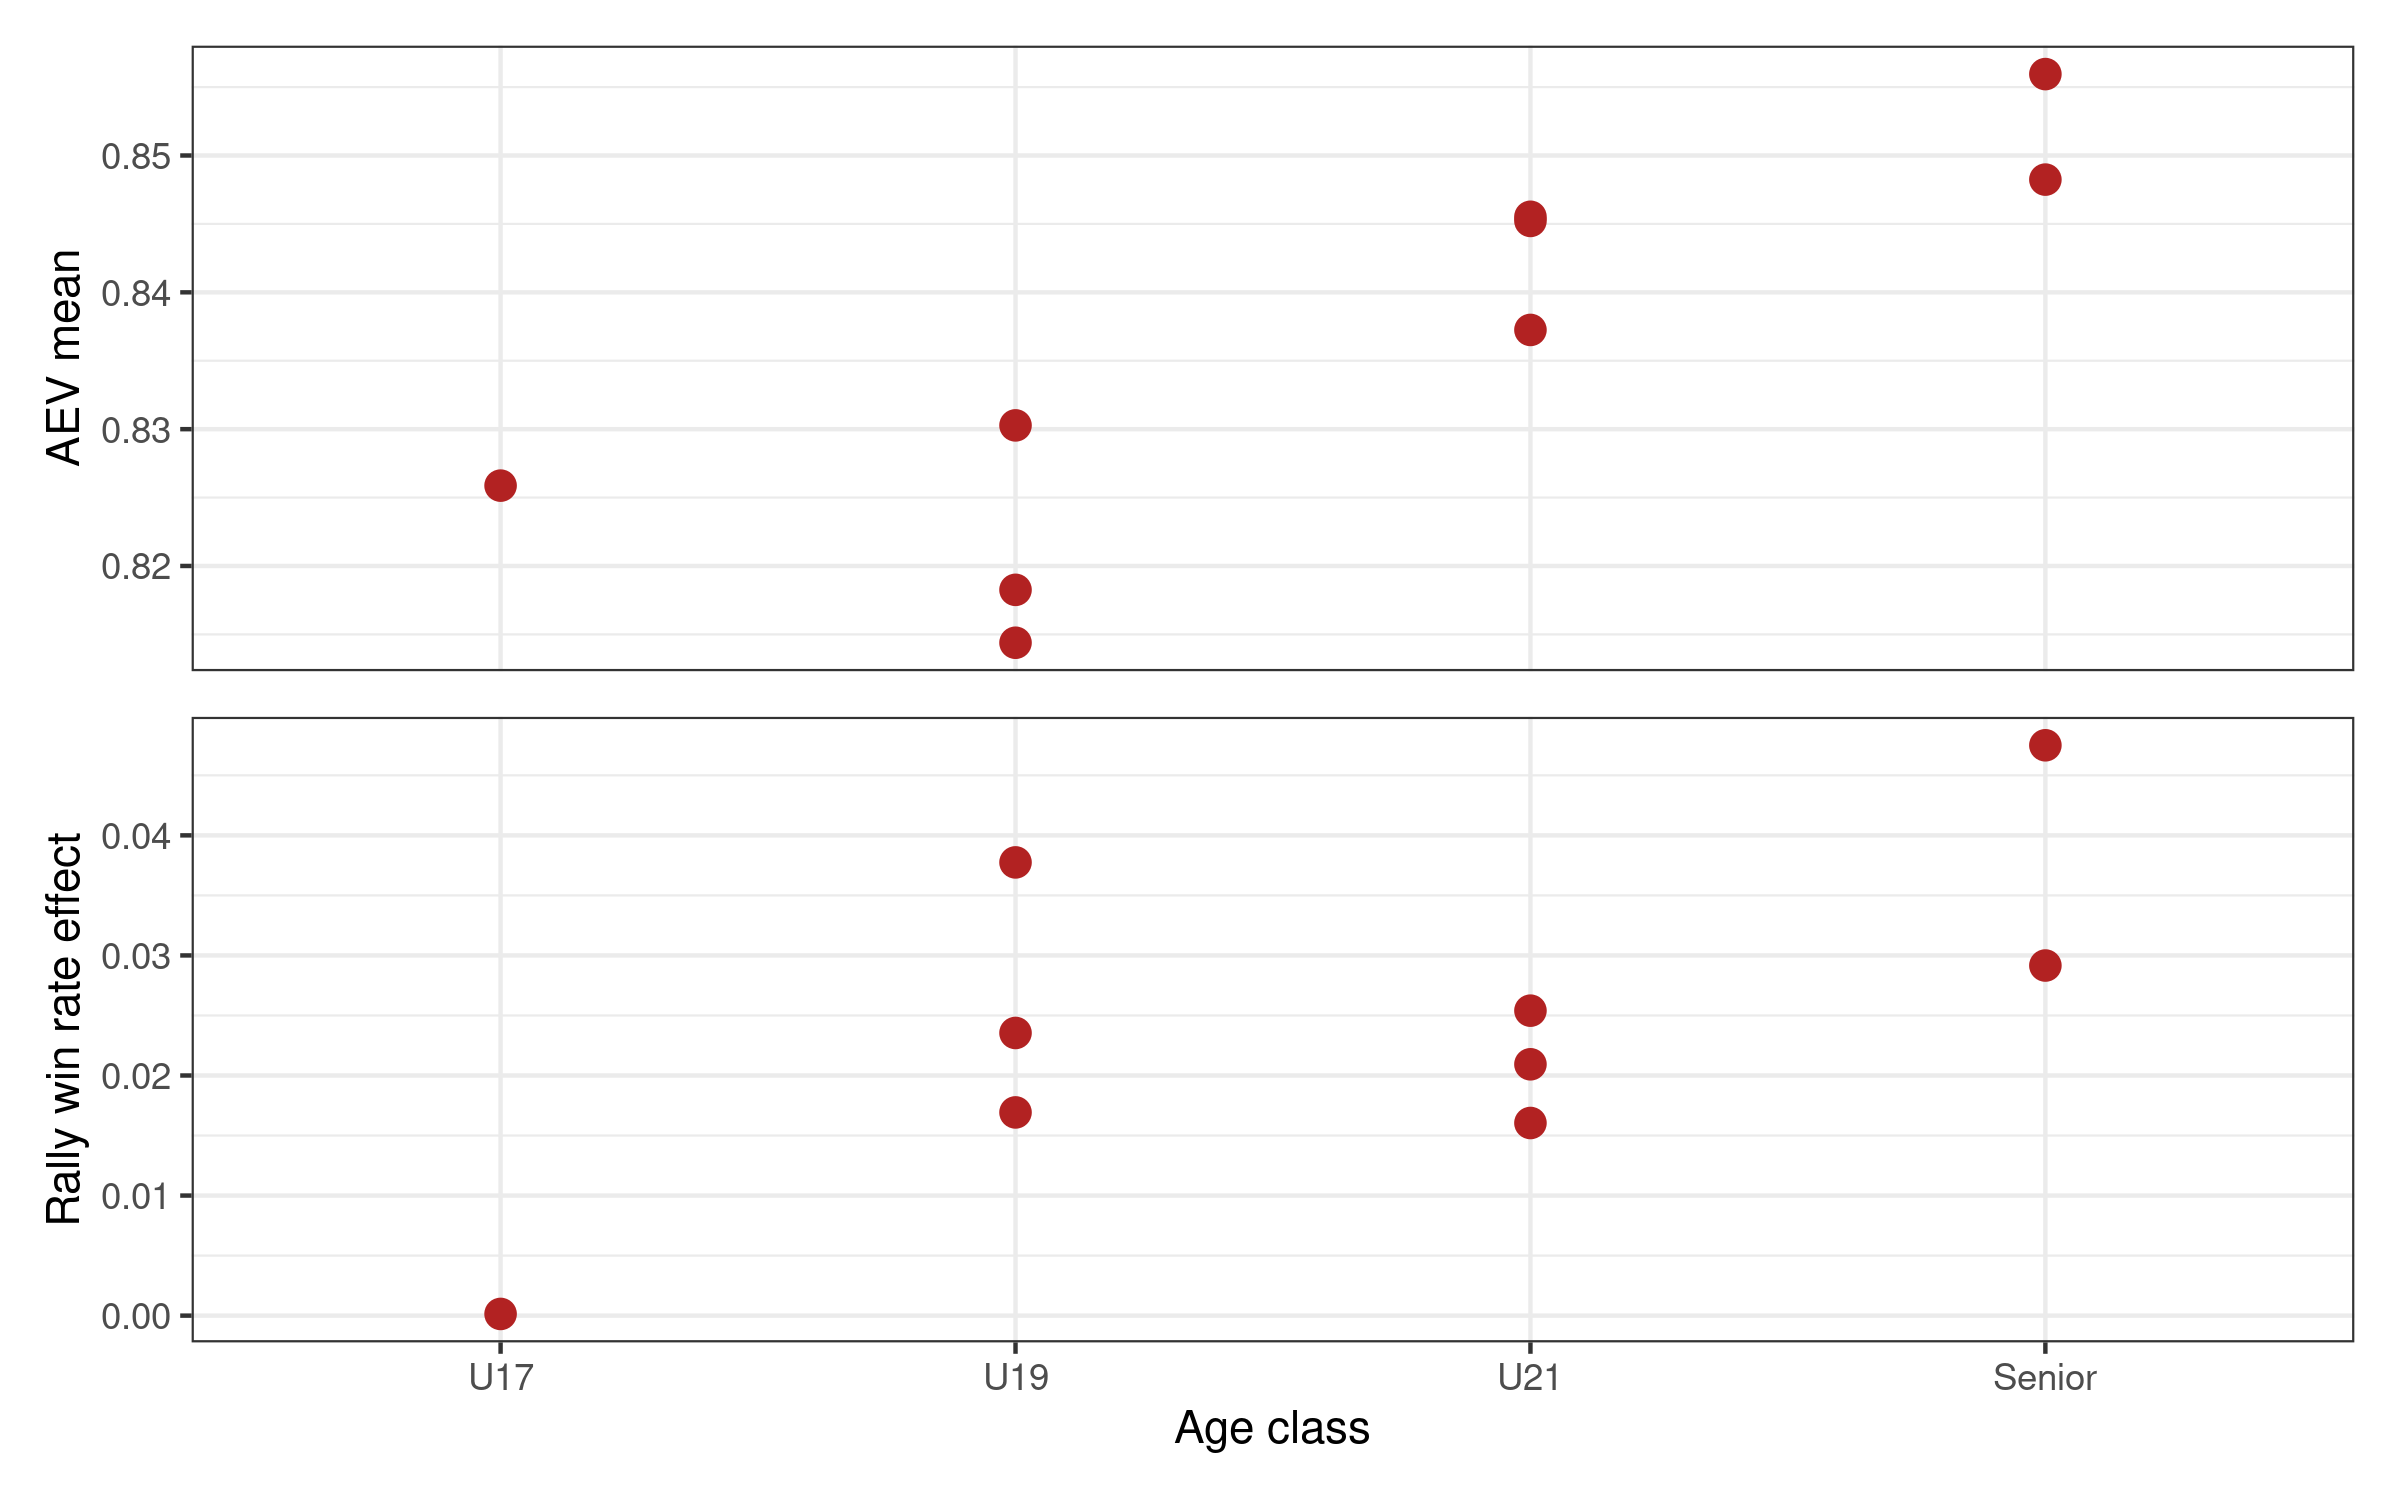
Attack evenness increases with age category for these competitions, particularly from U19 to U21. The trend in rally win rate effect is less clear but still broadly increasing with age category. Treat these particular results with caution: this is a very small data set (9 world championships competitions spread across 4 age groups).
Results: Changes over time
For competitions where we have multiple years worth of data, we plot the attack evenness and rally win rate effect over time.
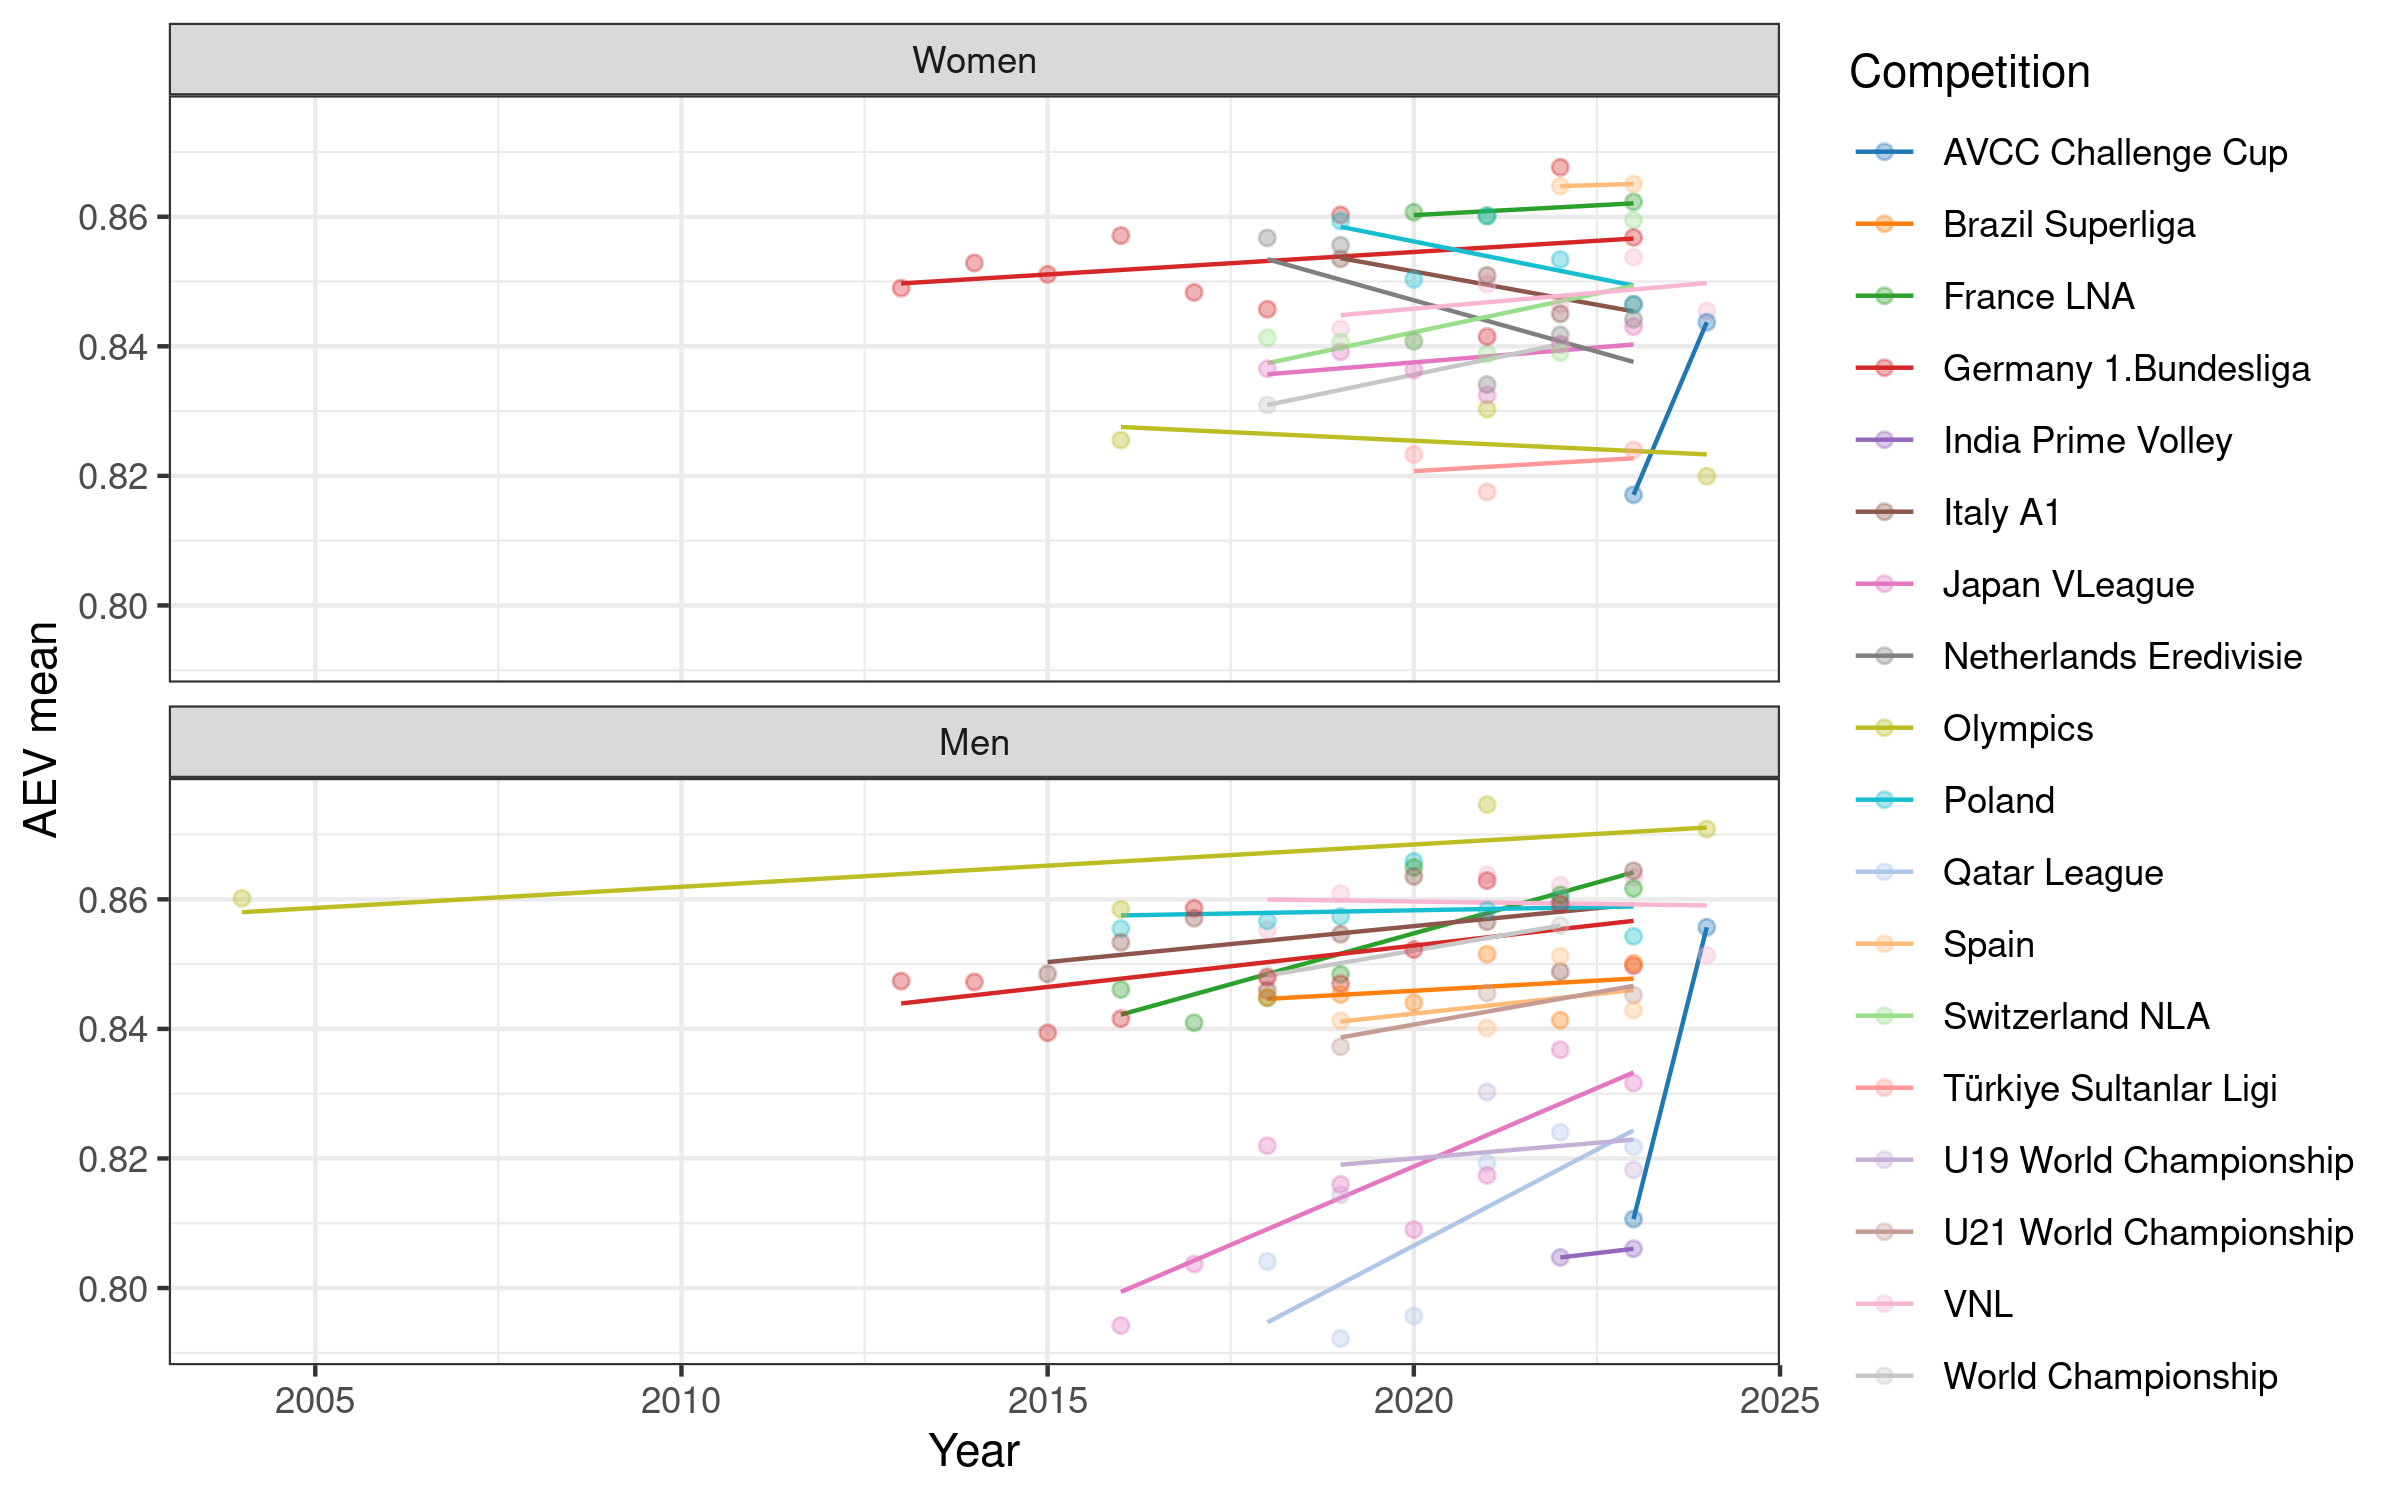
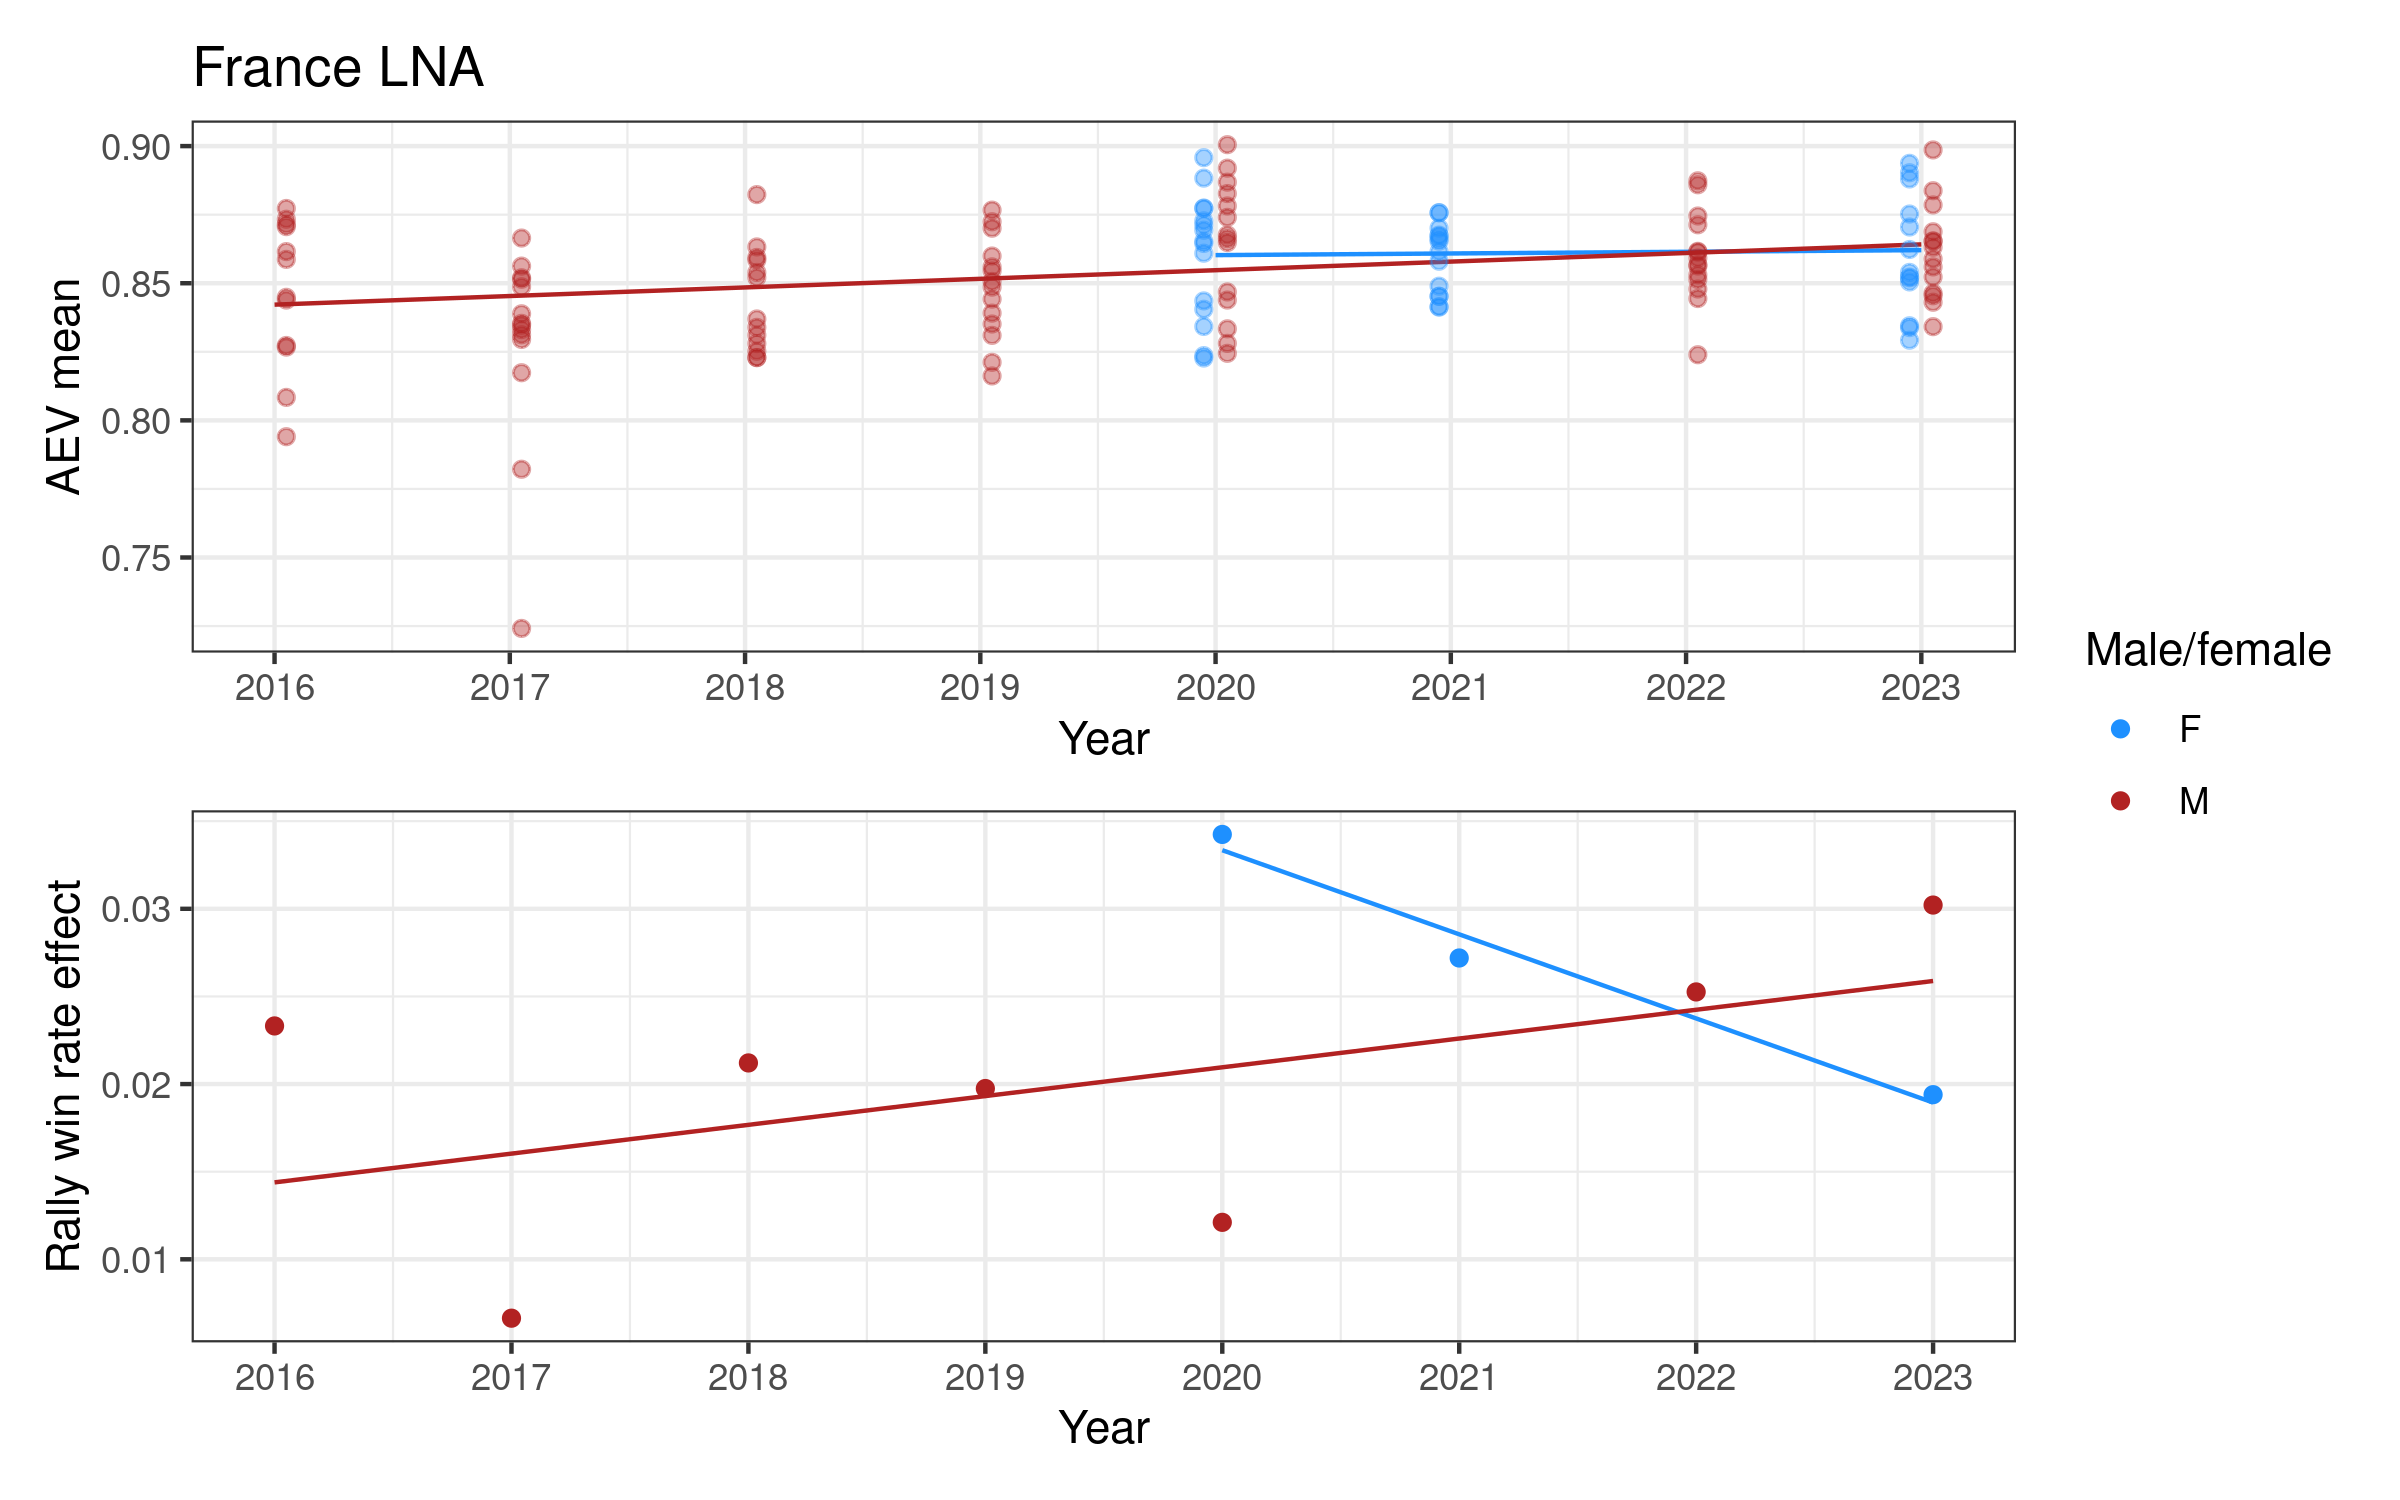
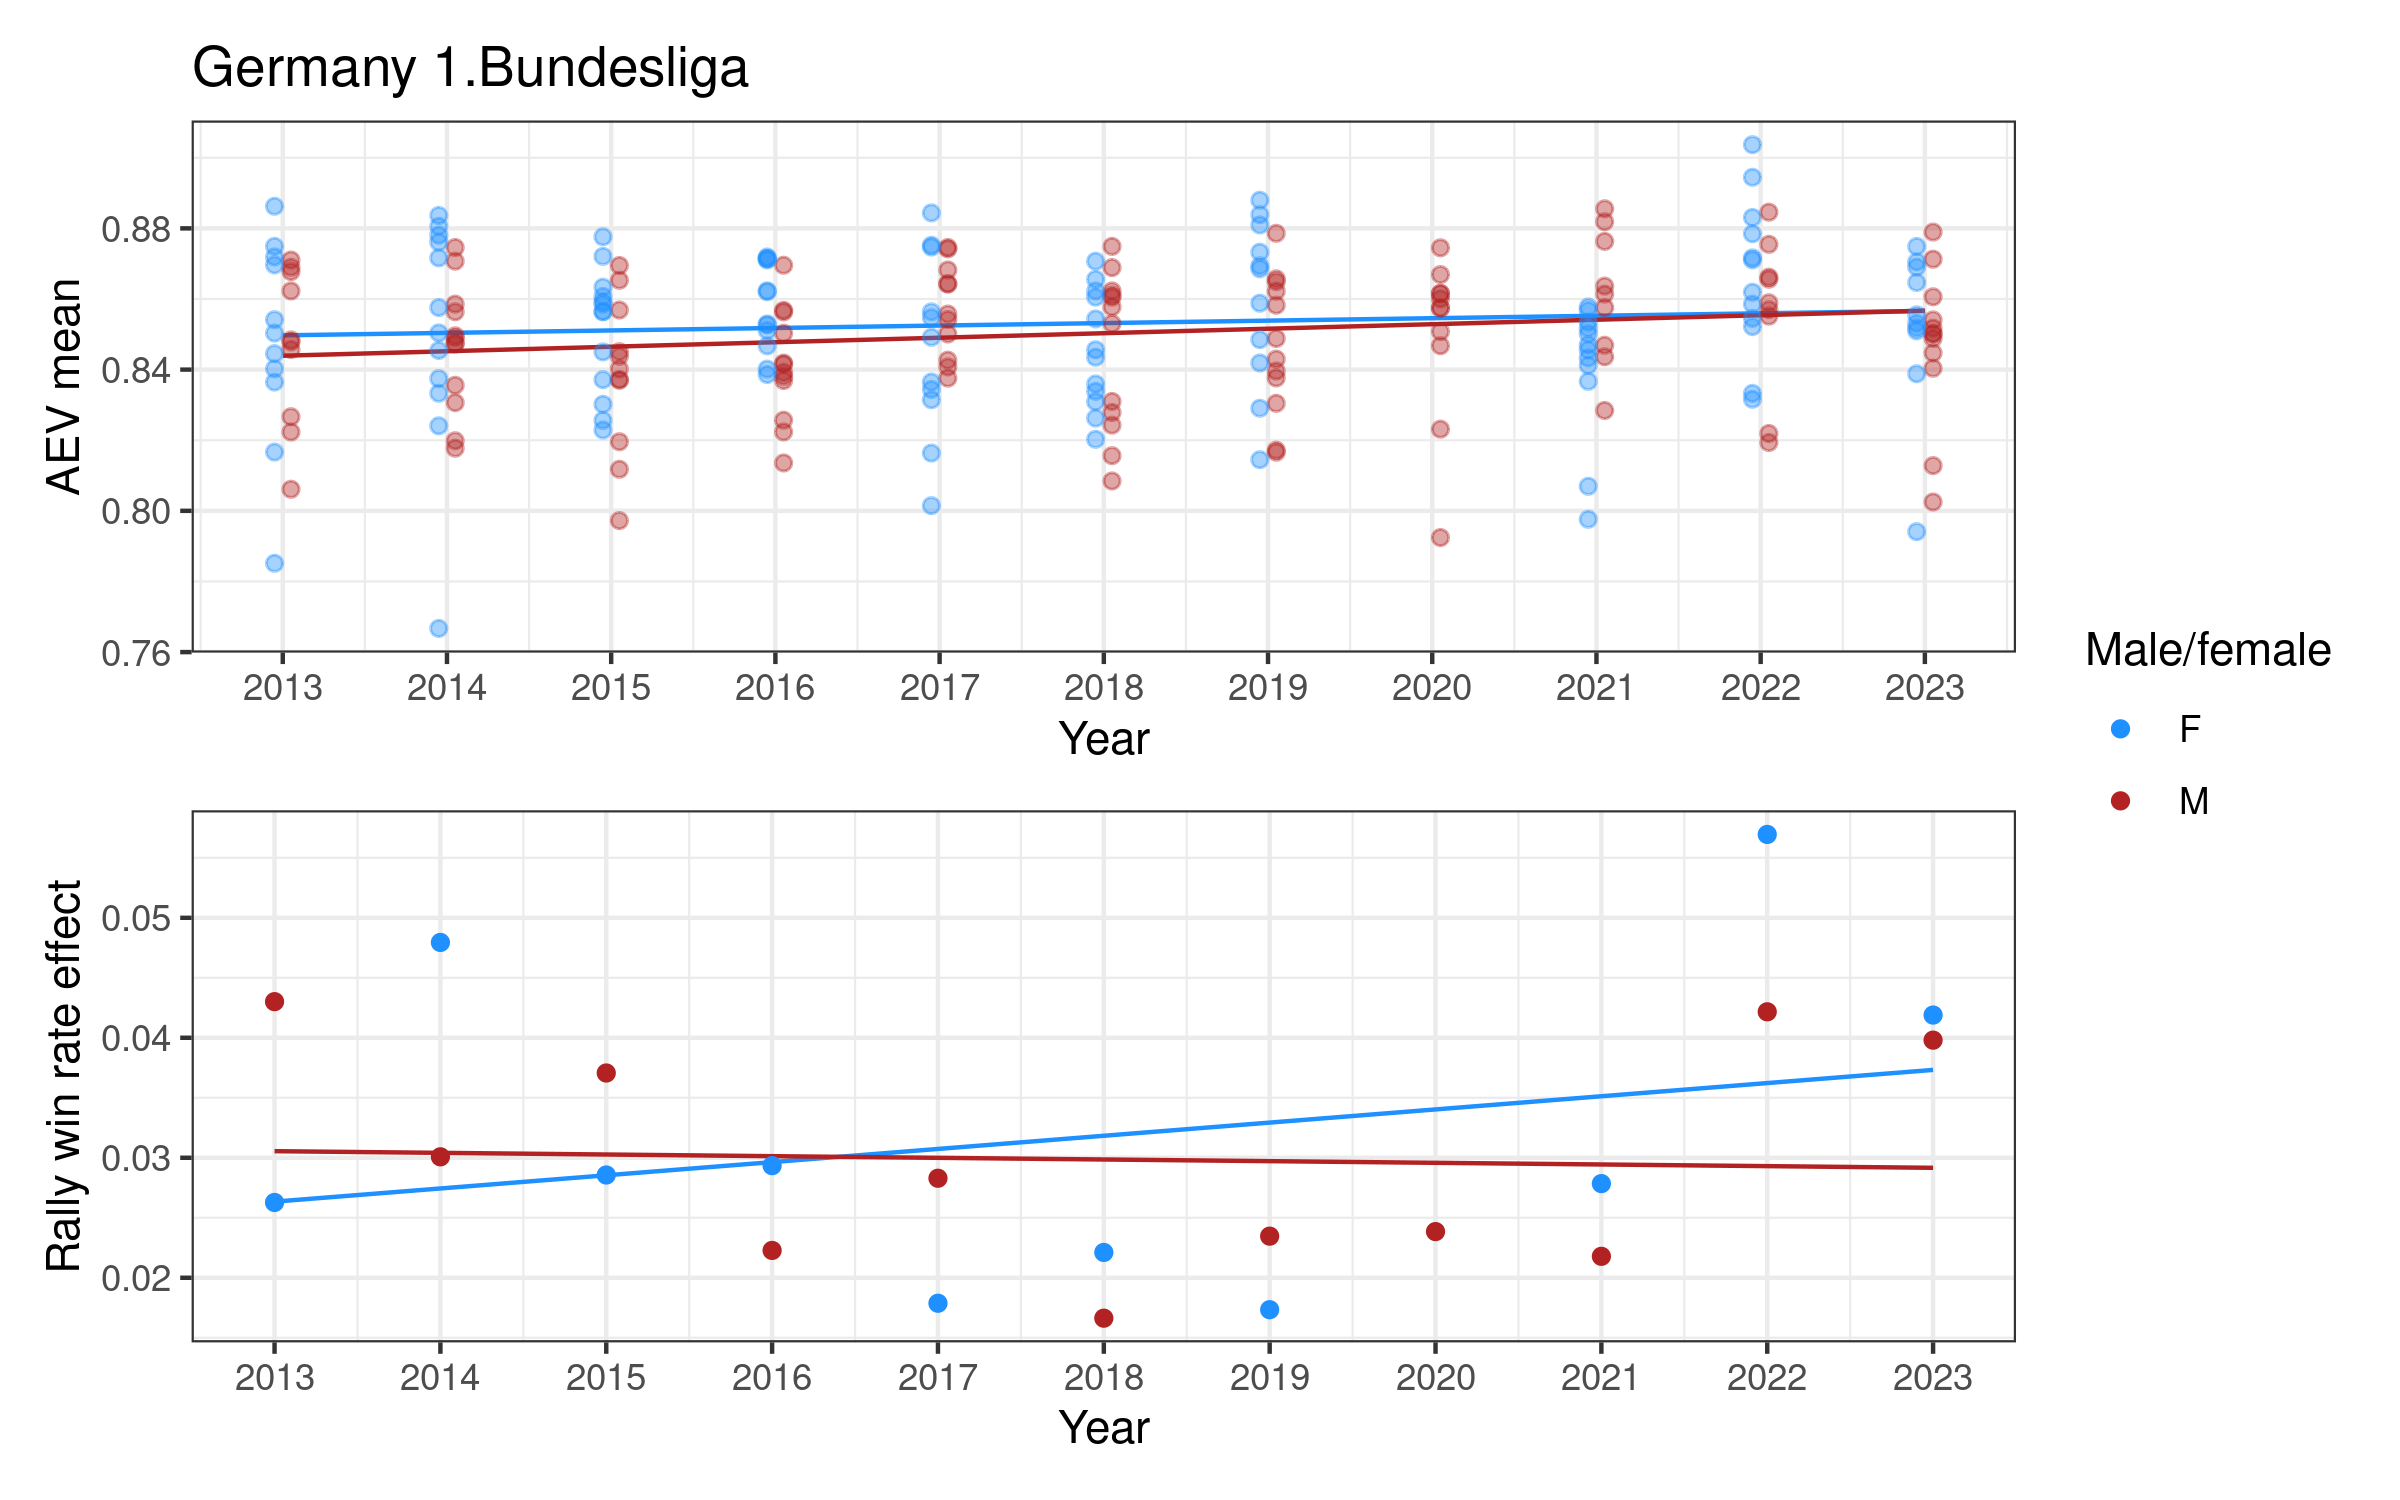
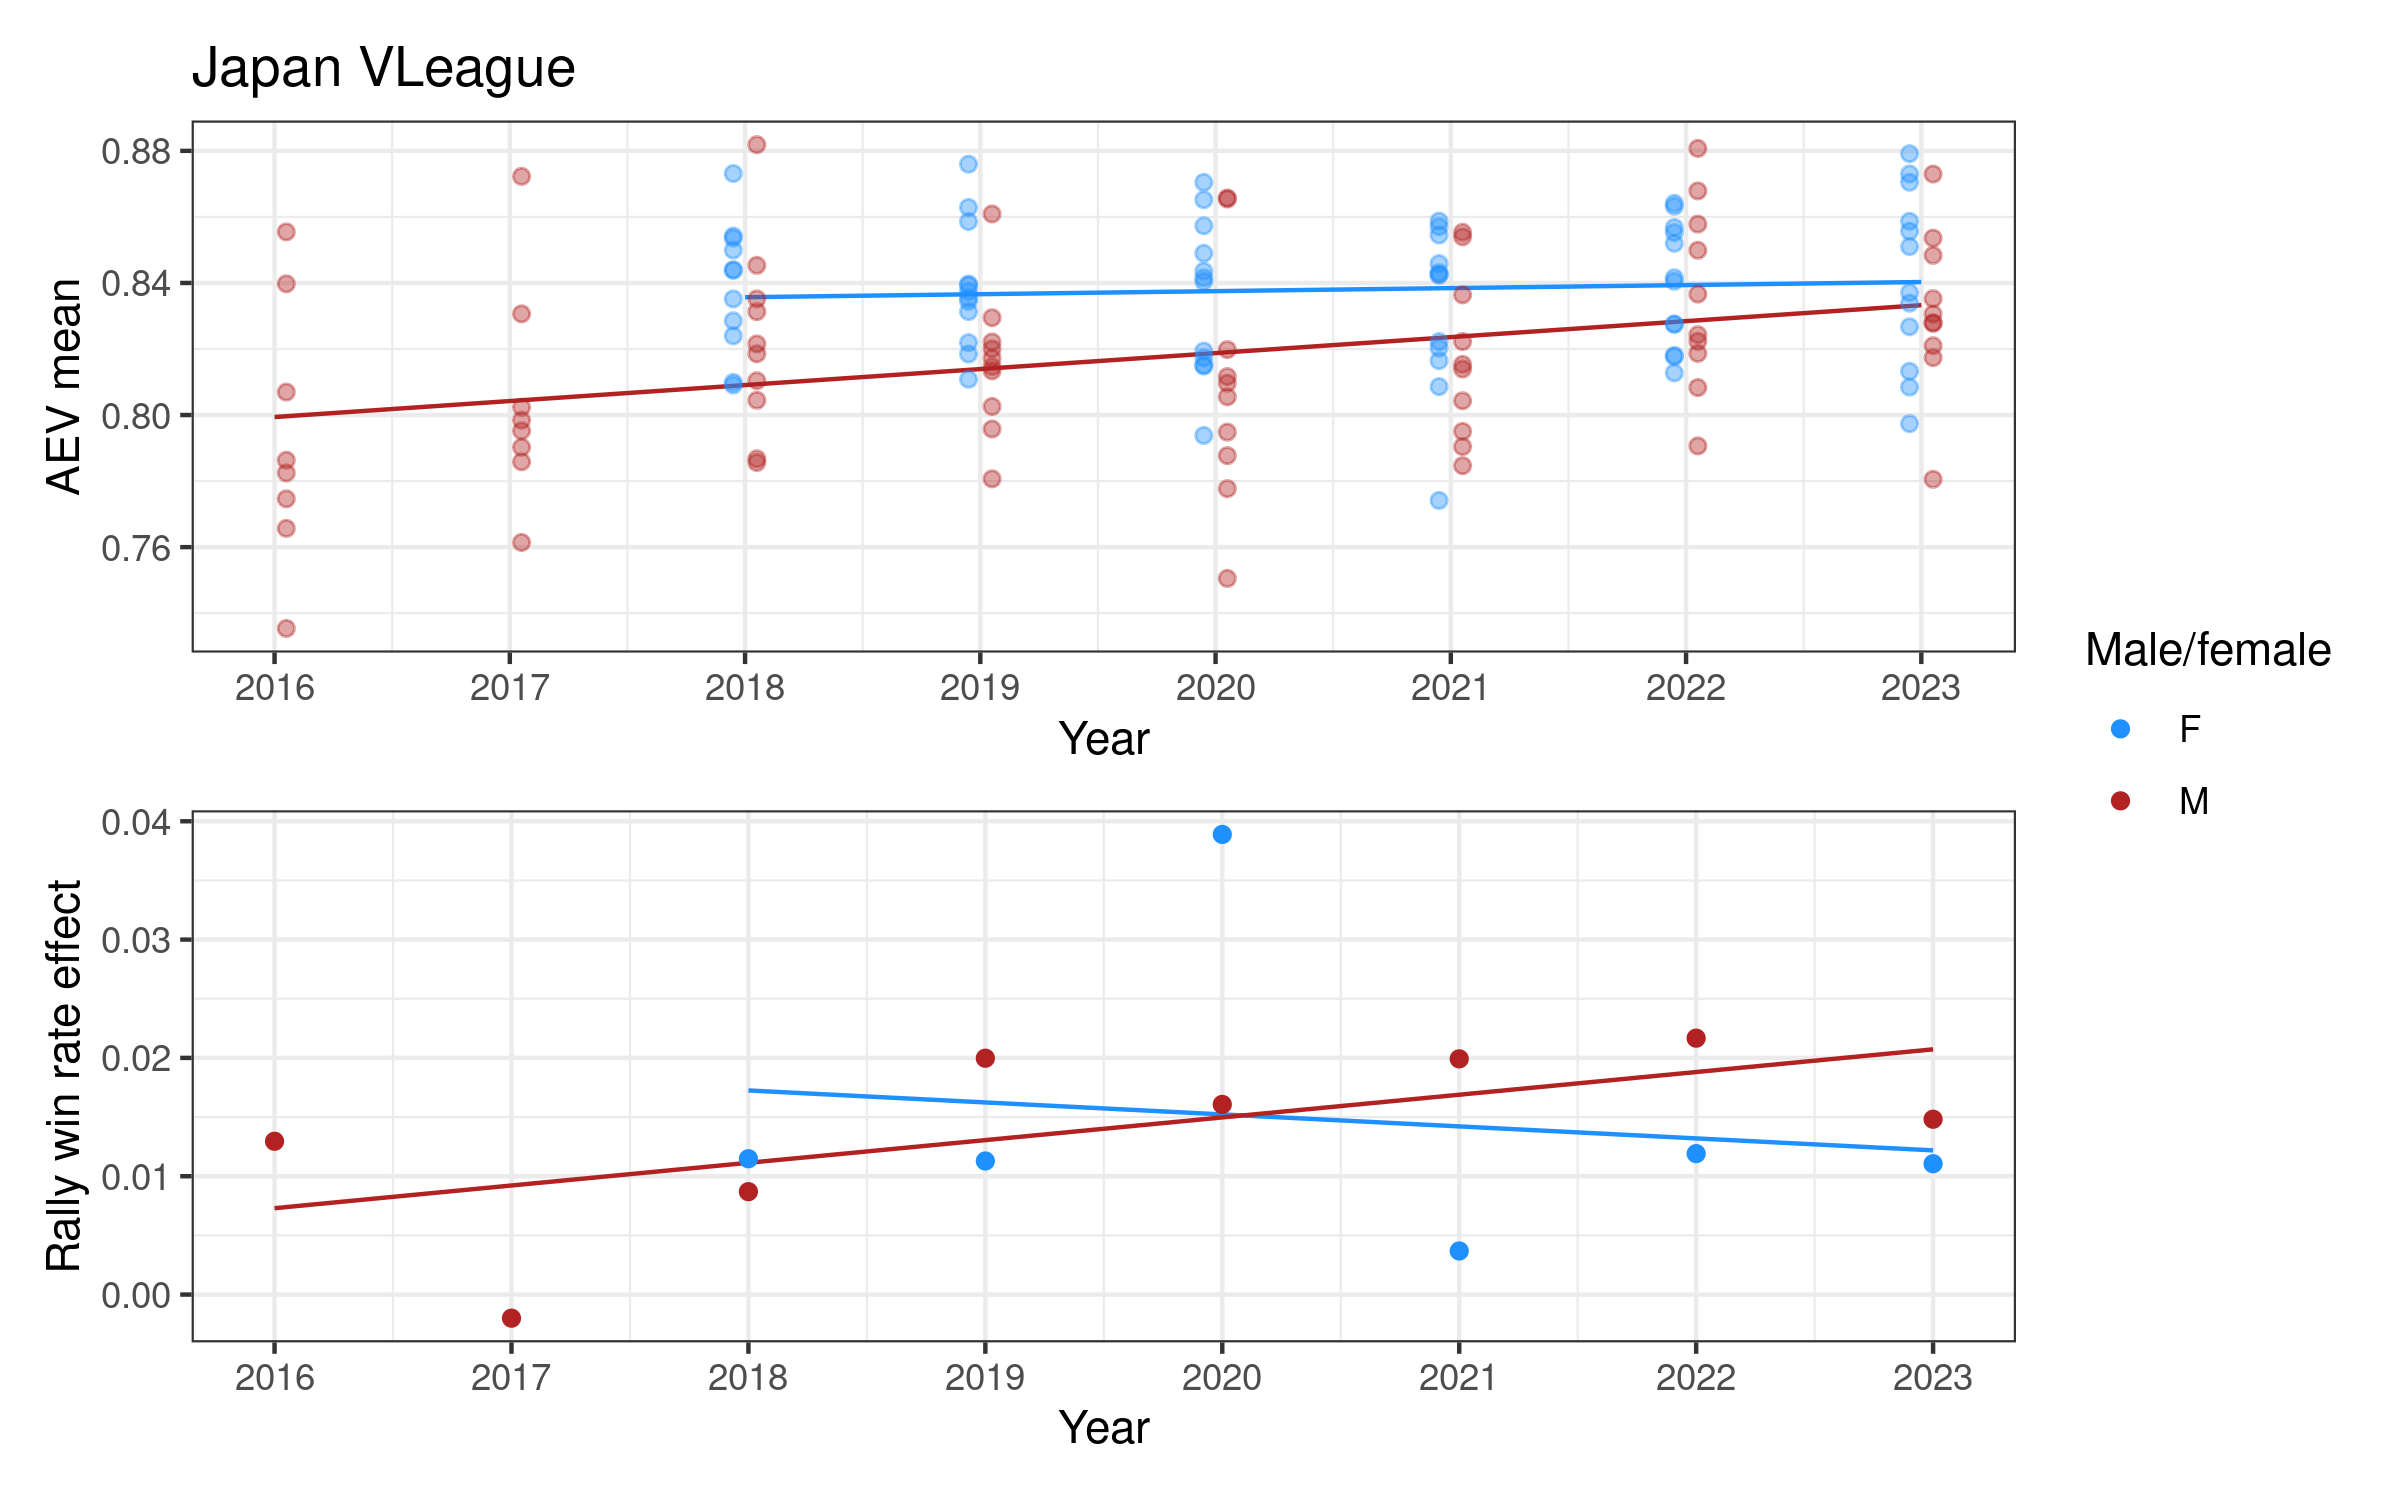
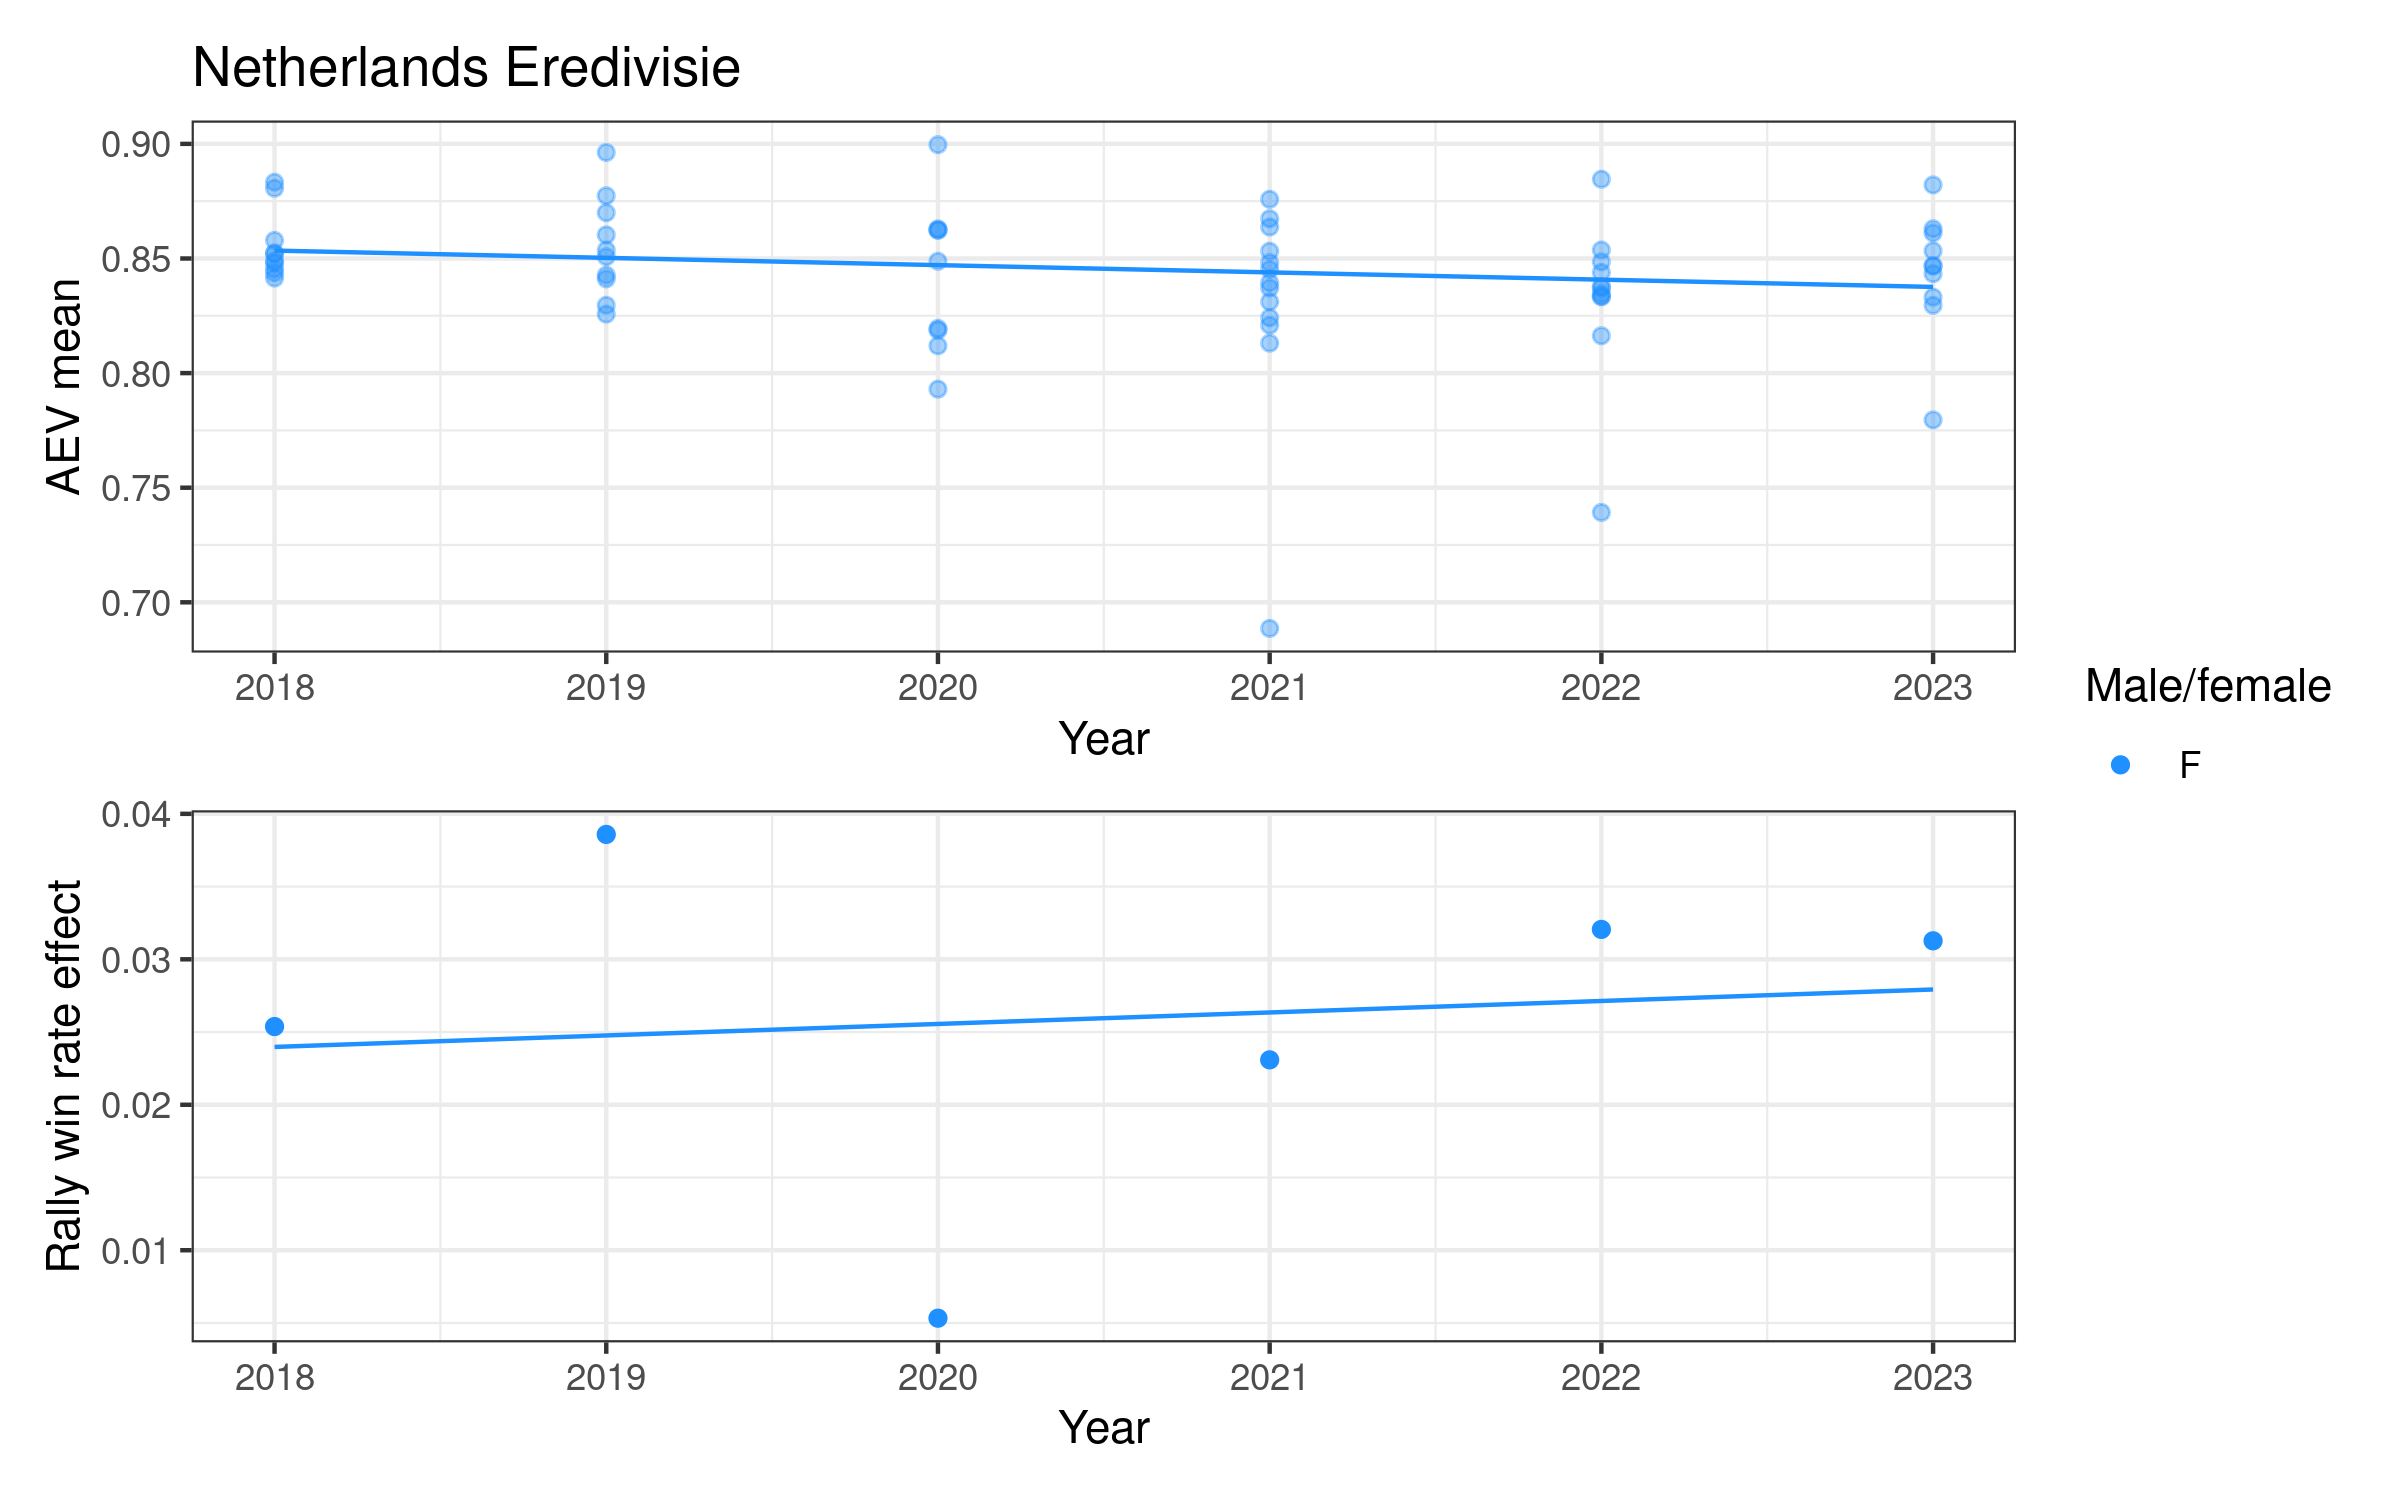
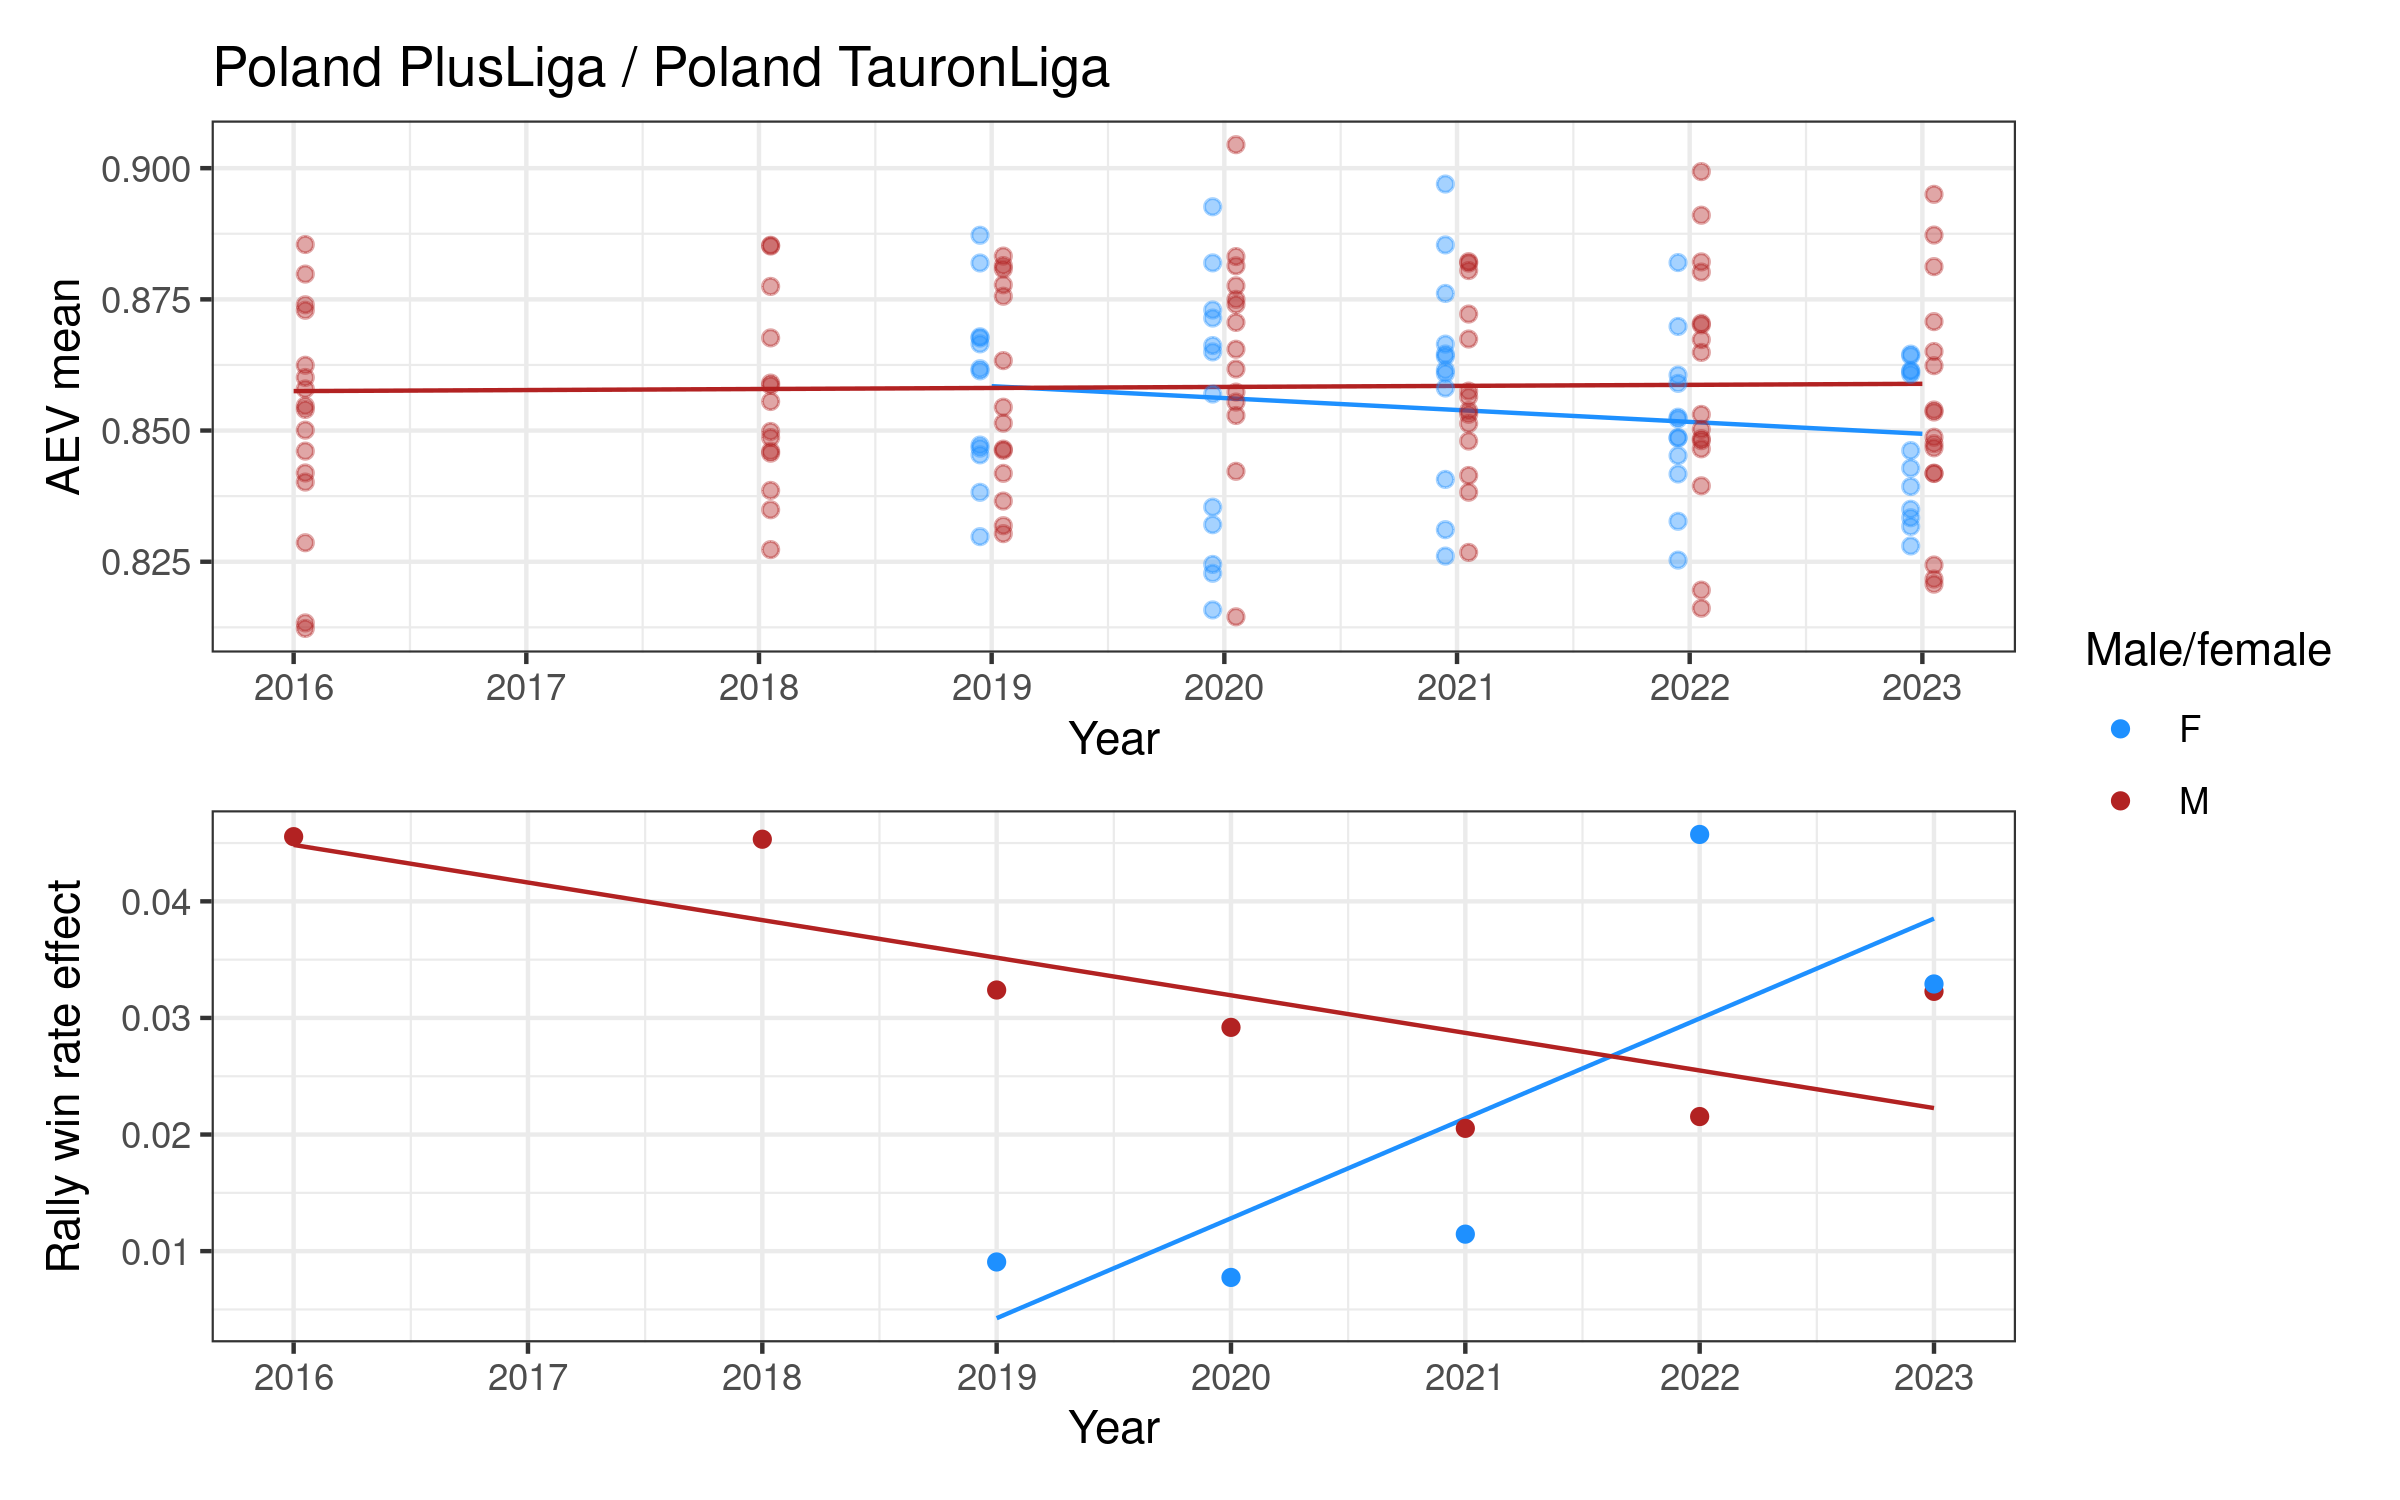
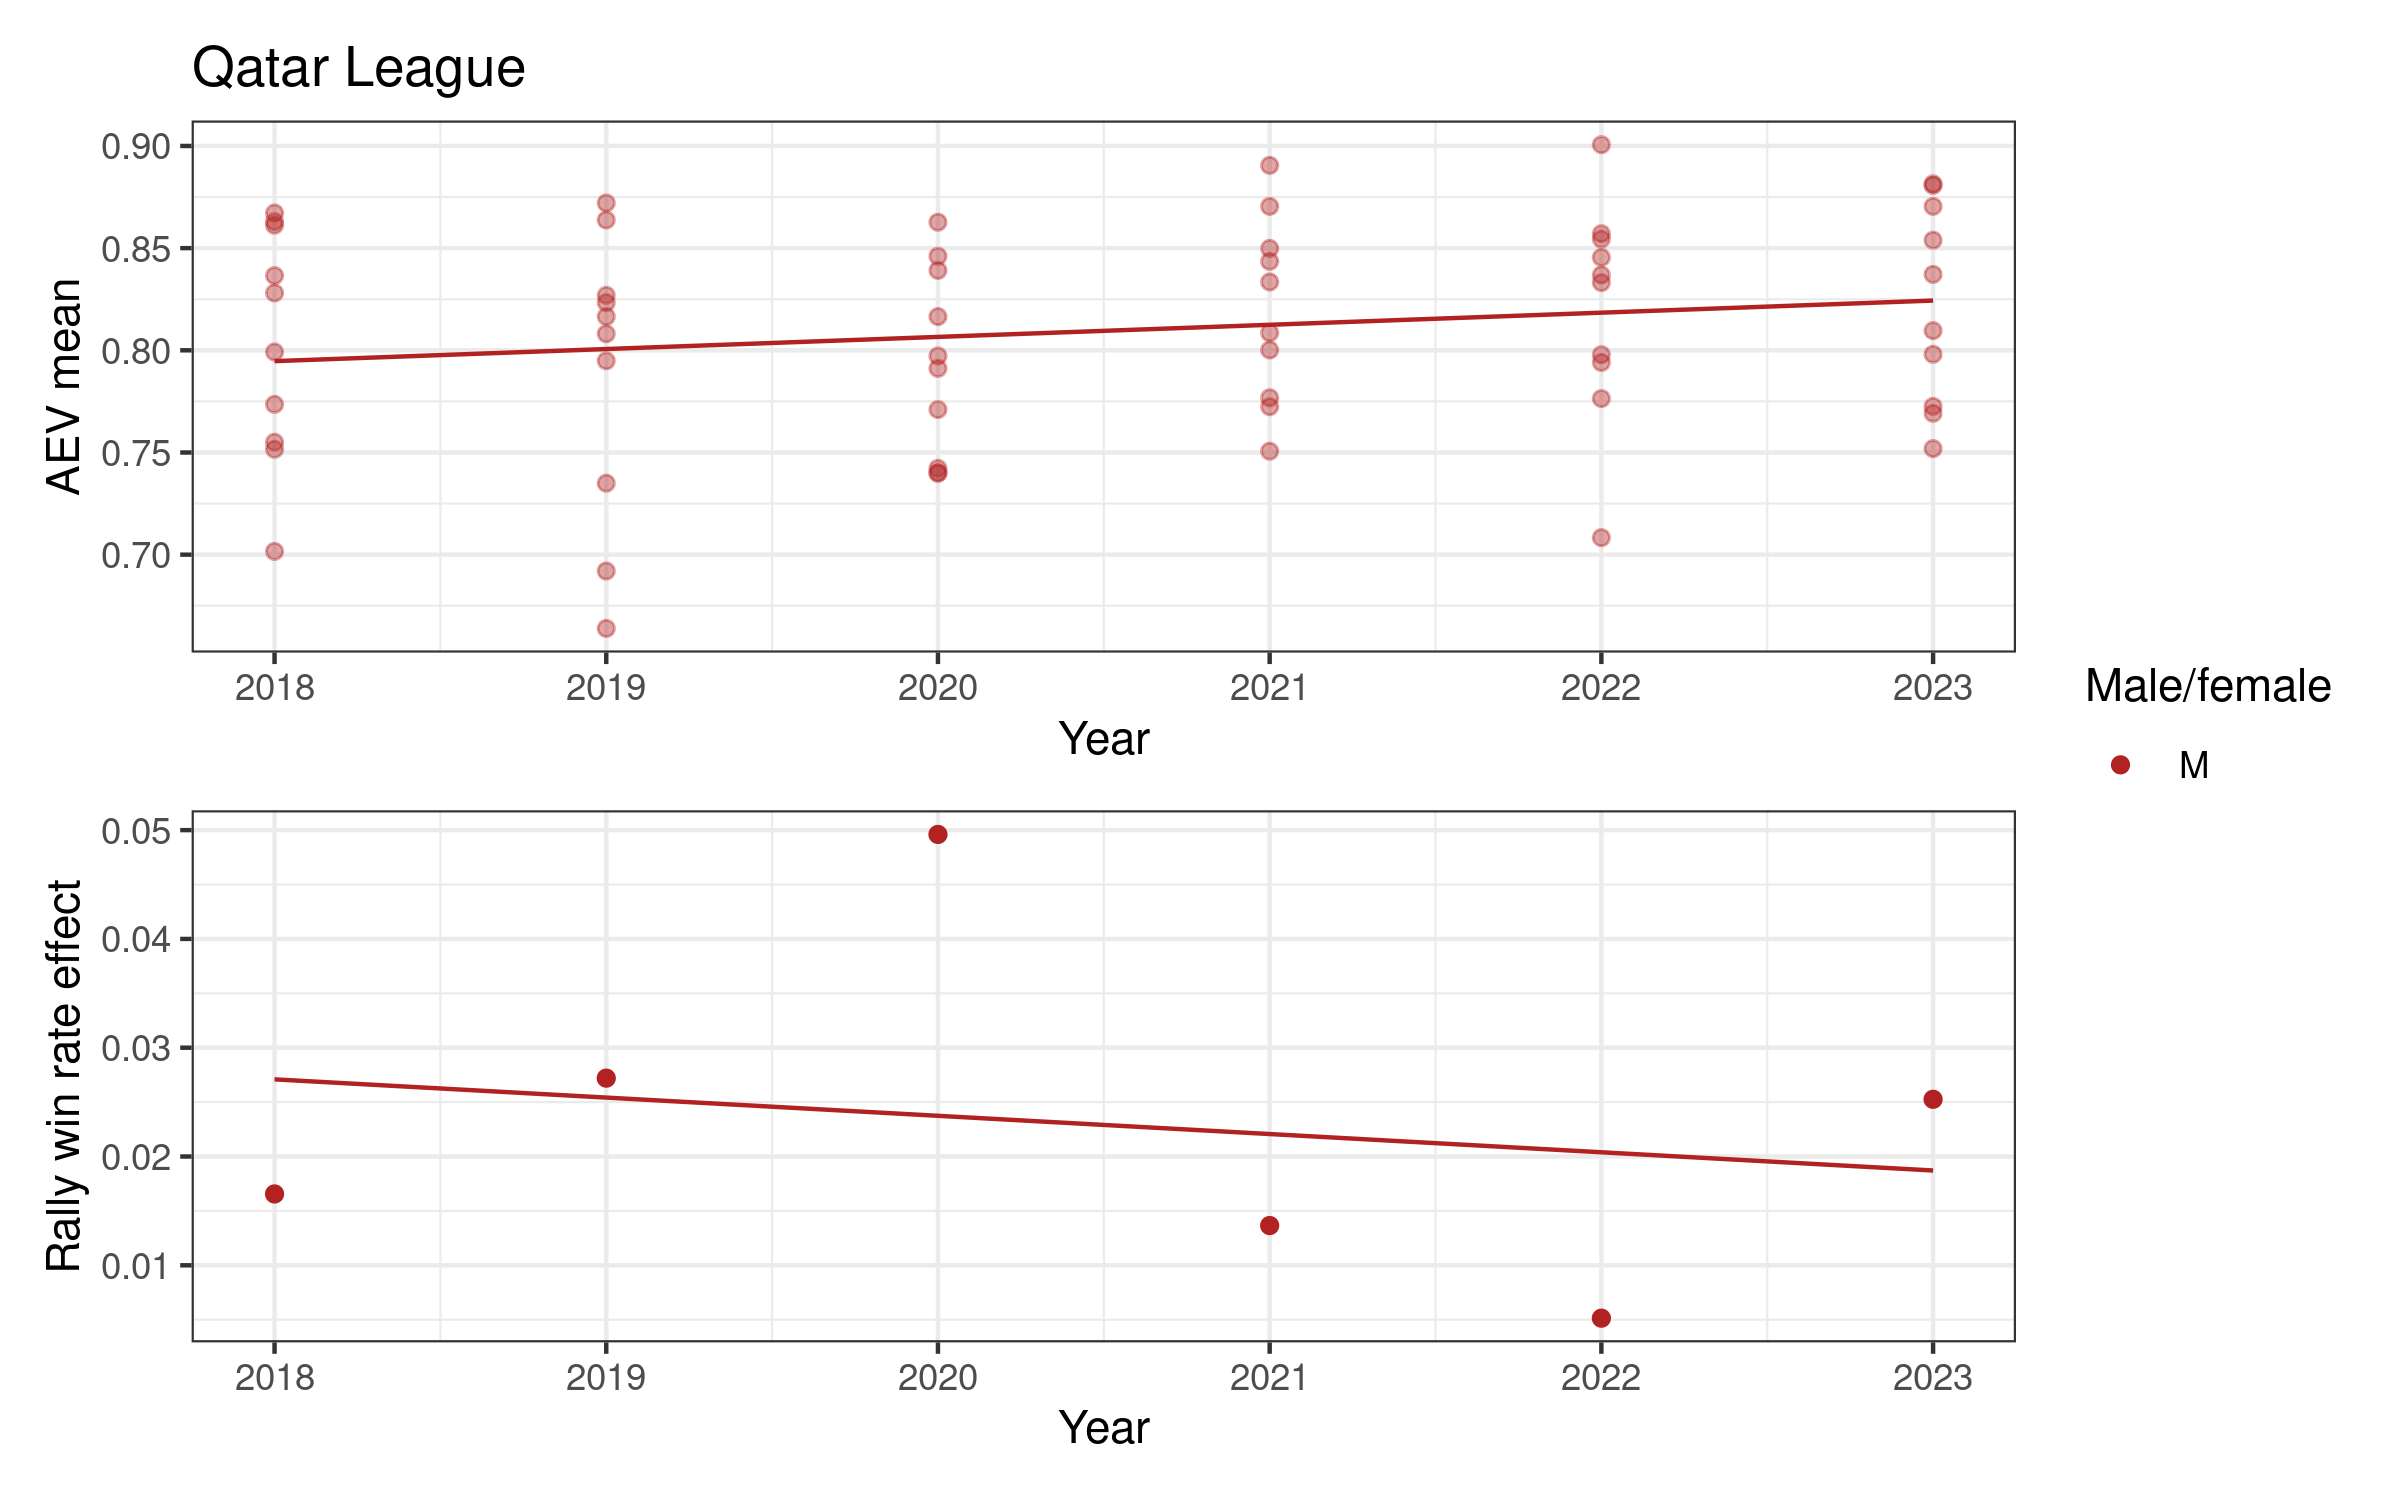
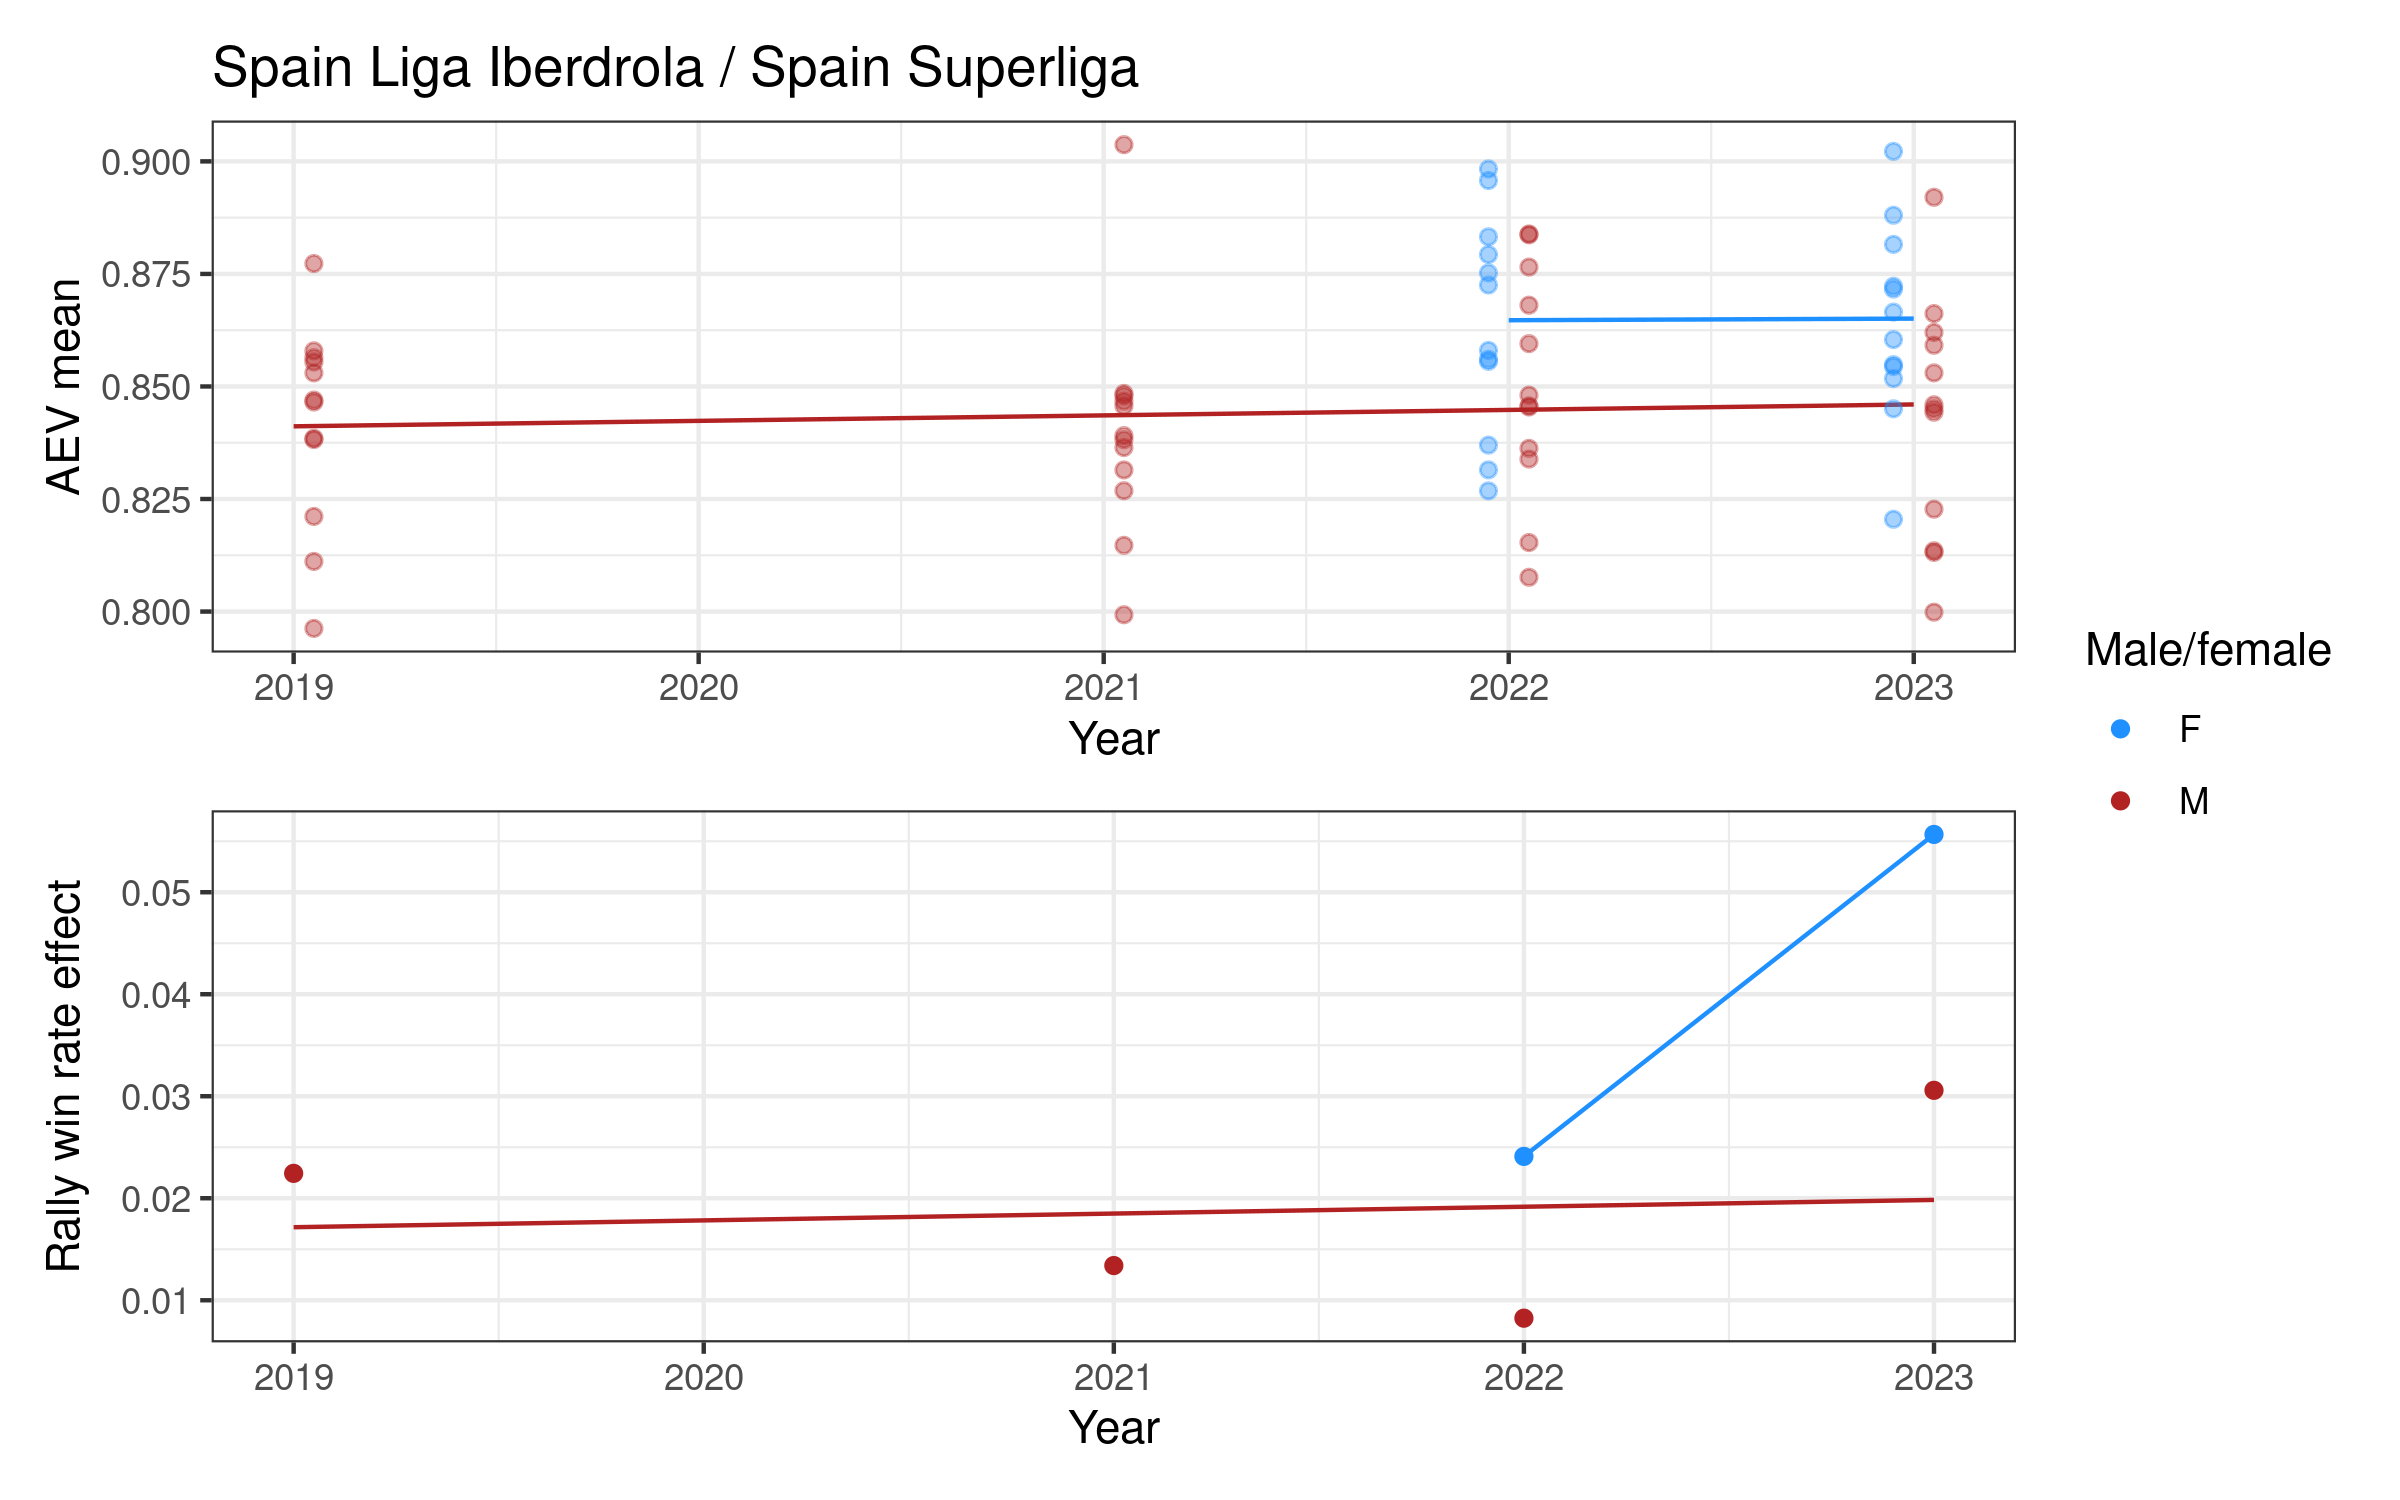
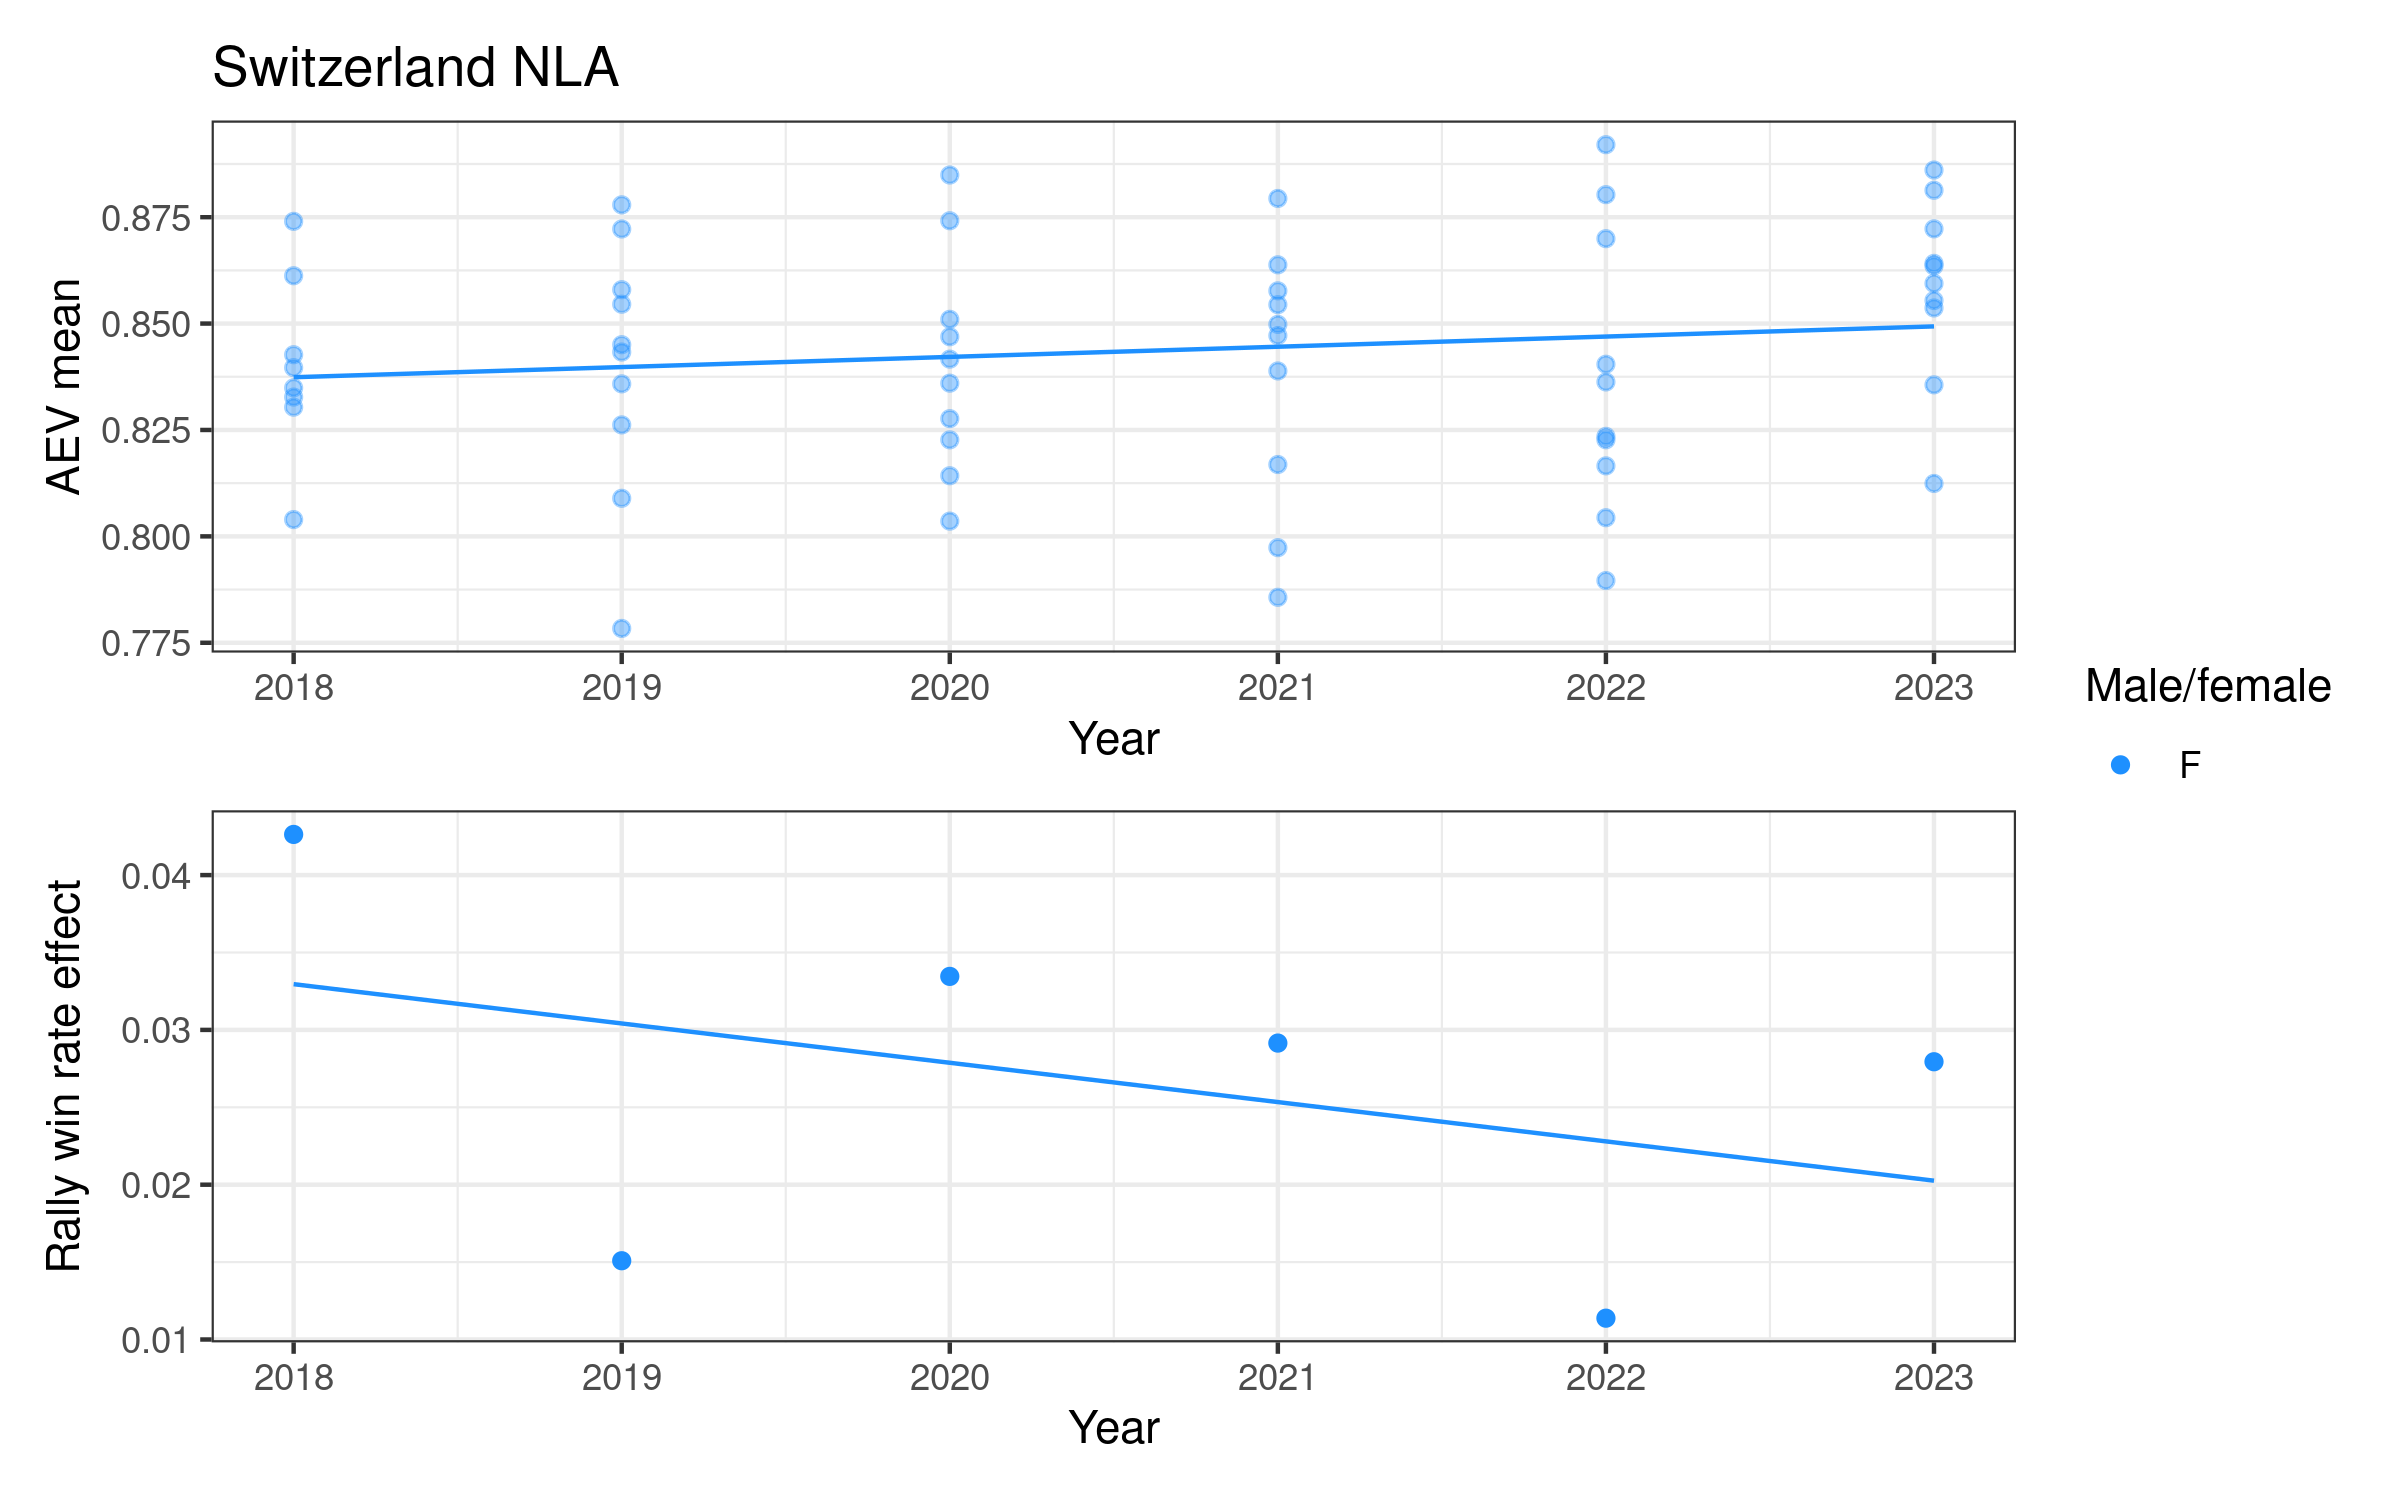
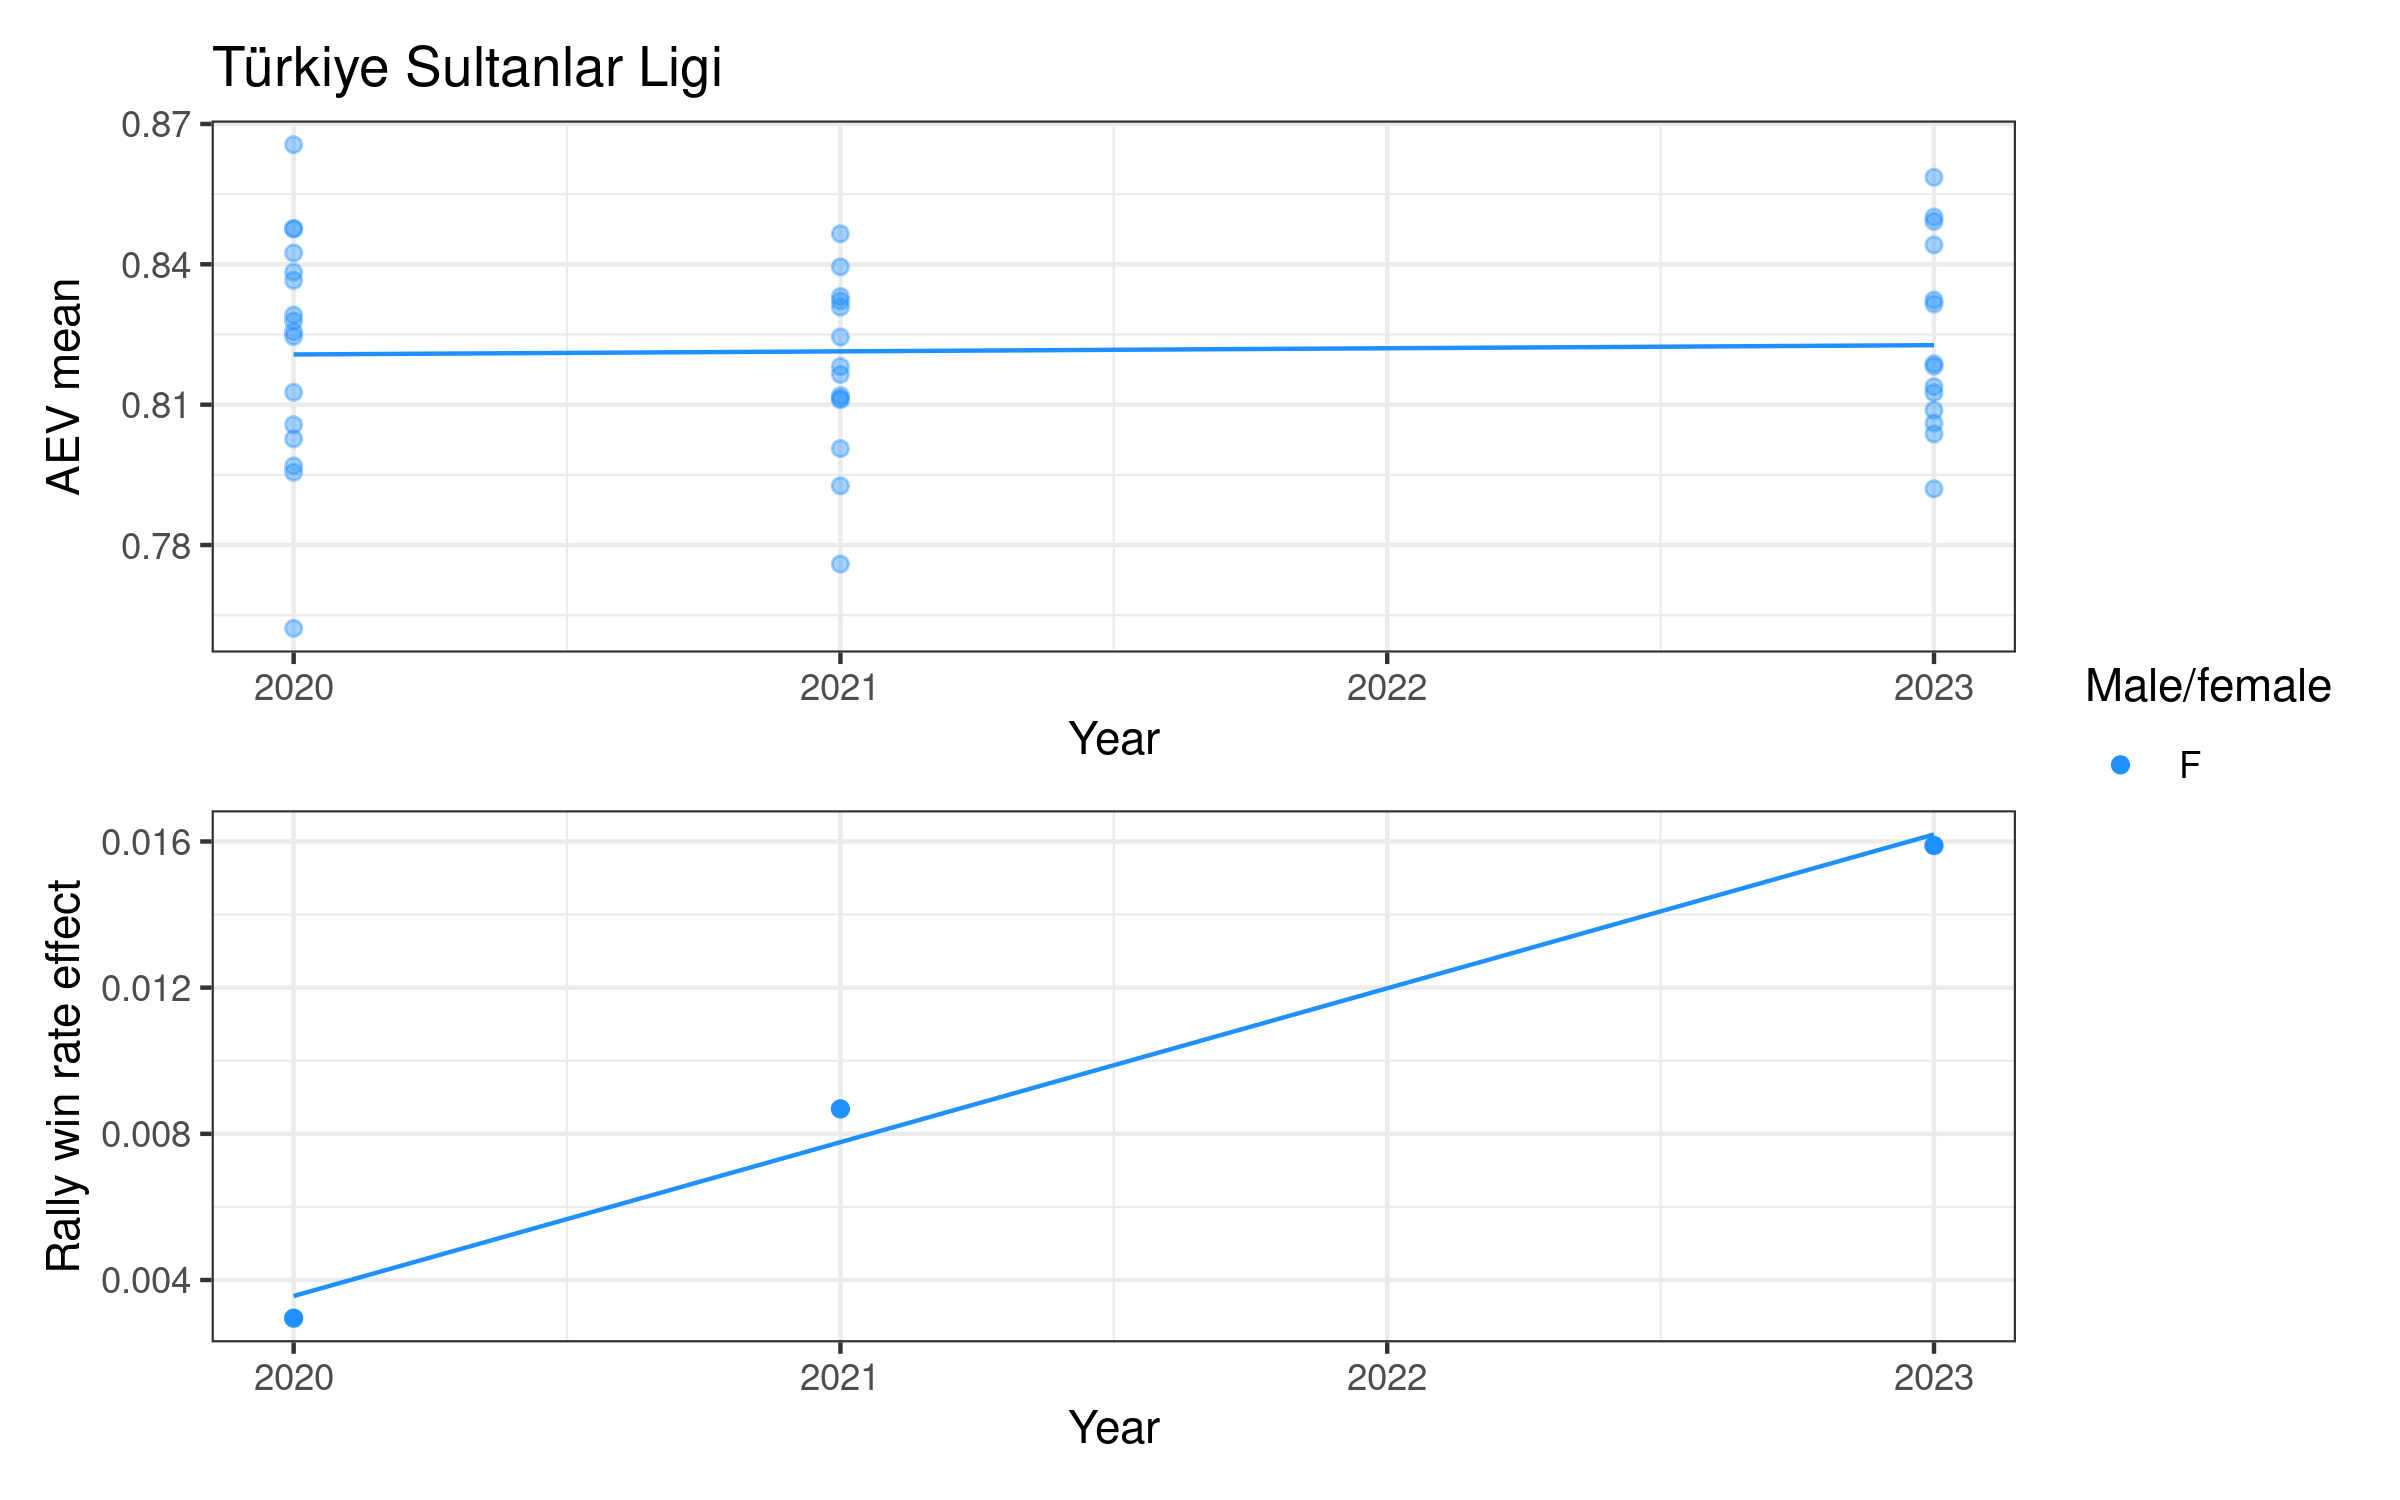
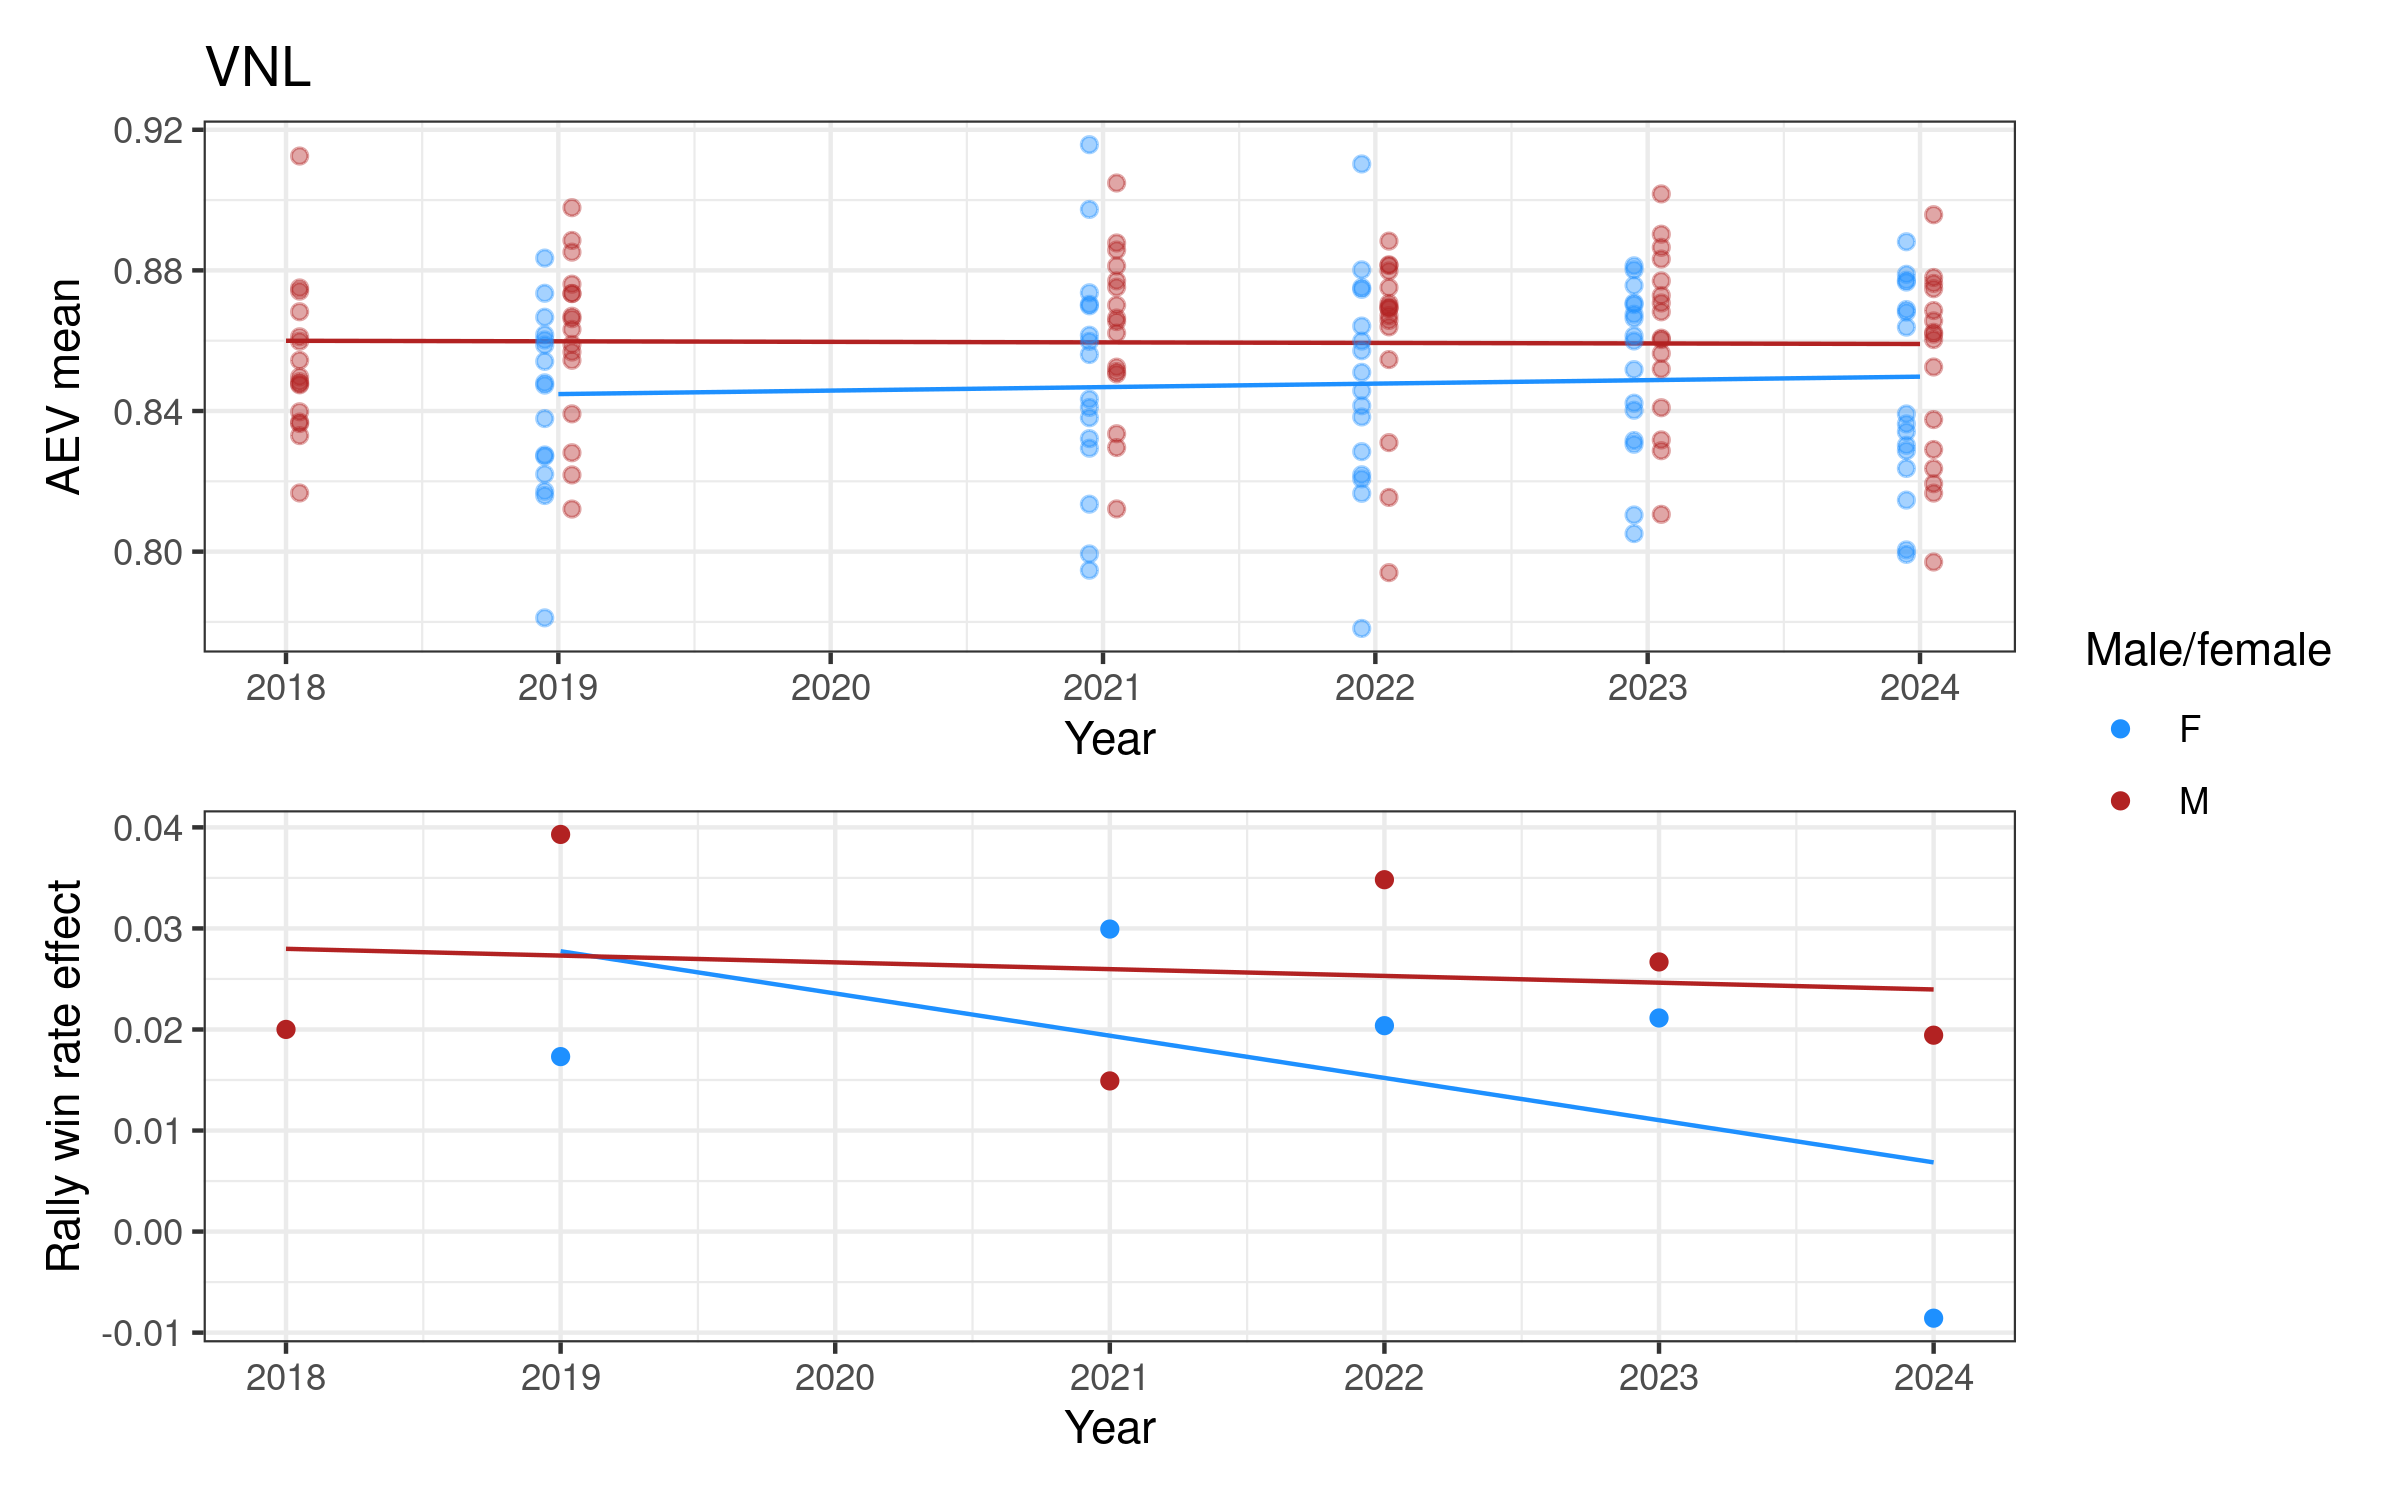
Attack evenness in some women’s competitions appears to have been decreasing over time (notably Italy, the Netherlands, and Poland), increasing in others (e.g. Switzerland and the VNL). For men, attack evenness has been generally increasing over time, most notably in France, Germany, Italy, Japan, Qatar, and Spain. It has been more or less stable in Poland and the VNL.
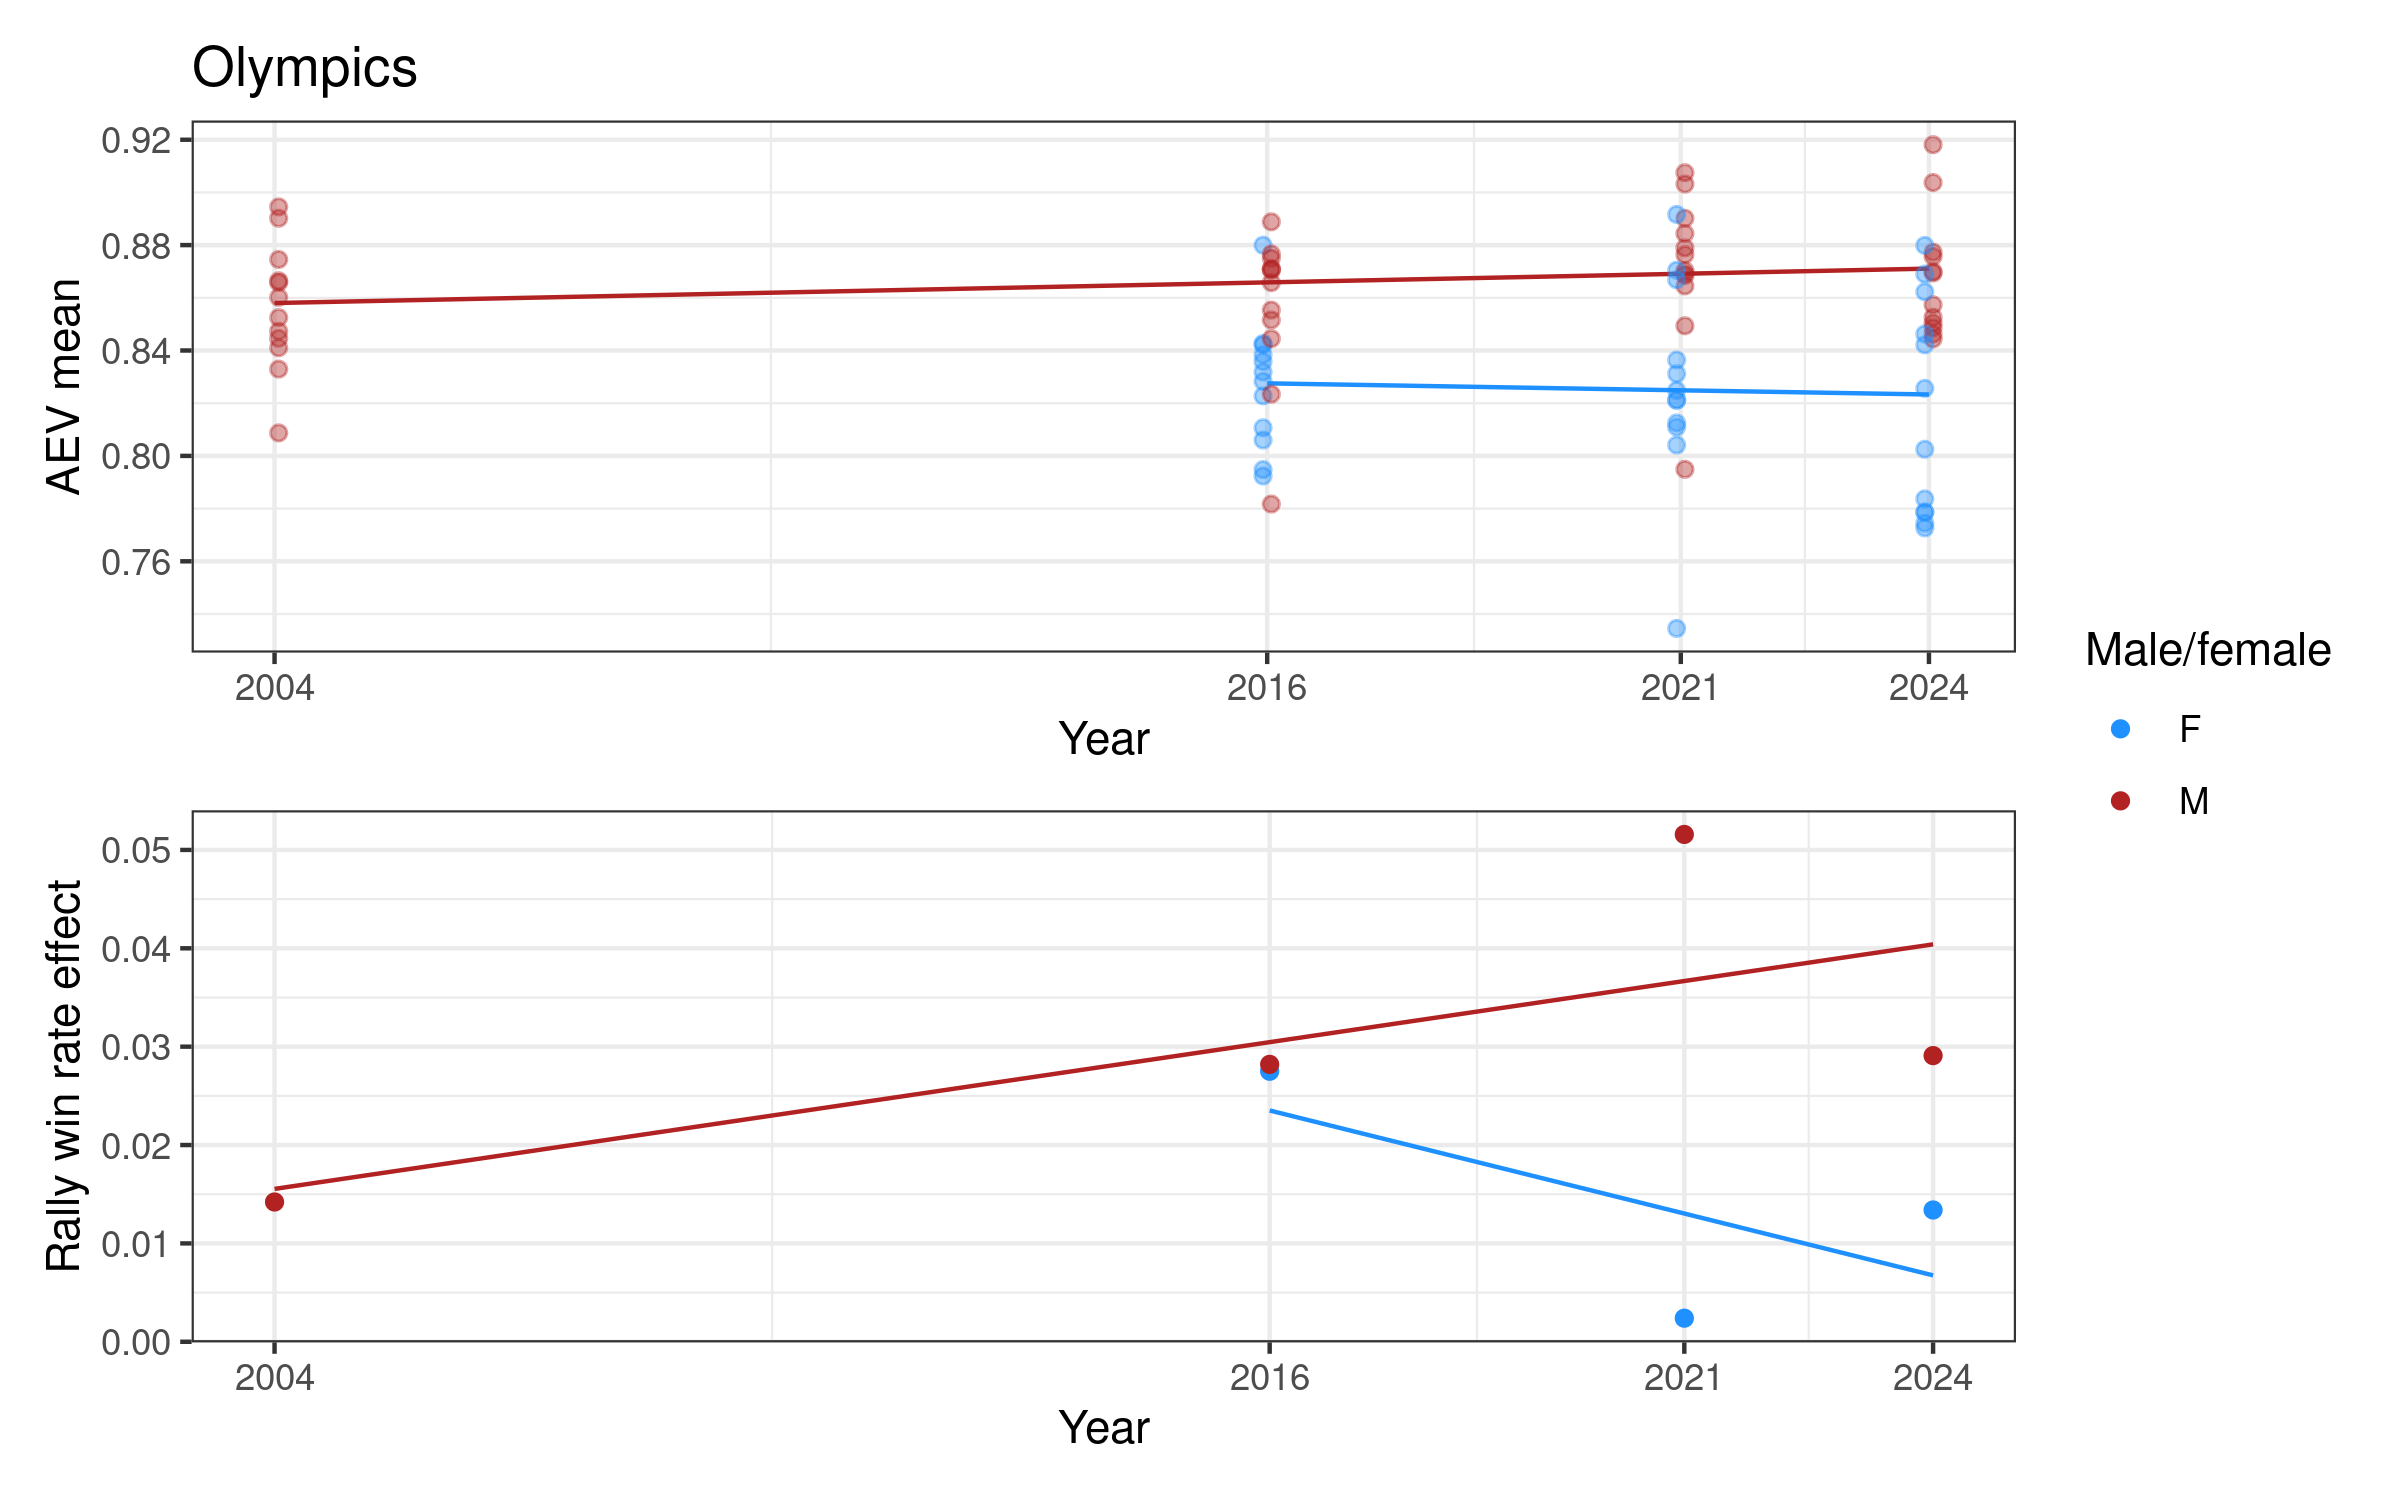
This plot also allows us to see that — despite the earlier finding that men’s and women’s competitions overall have a similar distribution of attack evenness values — in some competitions they are very different. Attack evenness in the women’s Olympics is consistently and substantially lower than the men’s, and the same is true (albeit to a lesser degree) in the VNL. This is because a number of women’s national teams rely very heavily on one or two attackers, whereas men’s tend to be more balanced. In the 2024 Olympics, the women’s teams of France, Italy, Japan, Serbia, and Türkiye all had attack evenness values around 0.78. The lowest men’s attack evenness in the 2024 Olympics was Poland with a value of 0.84. (You can explore the attack load carried by individual players via our Olympics player statistics leaderboard).
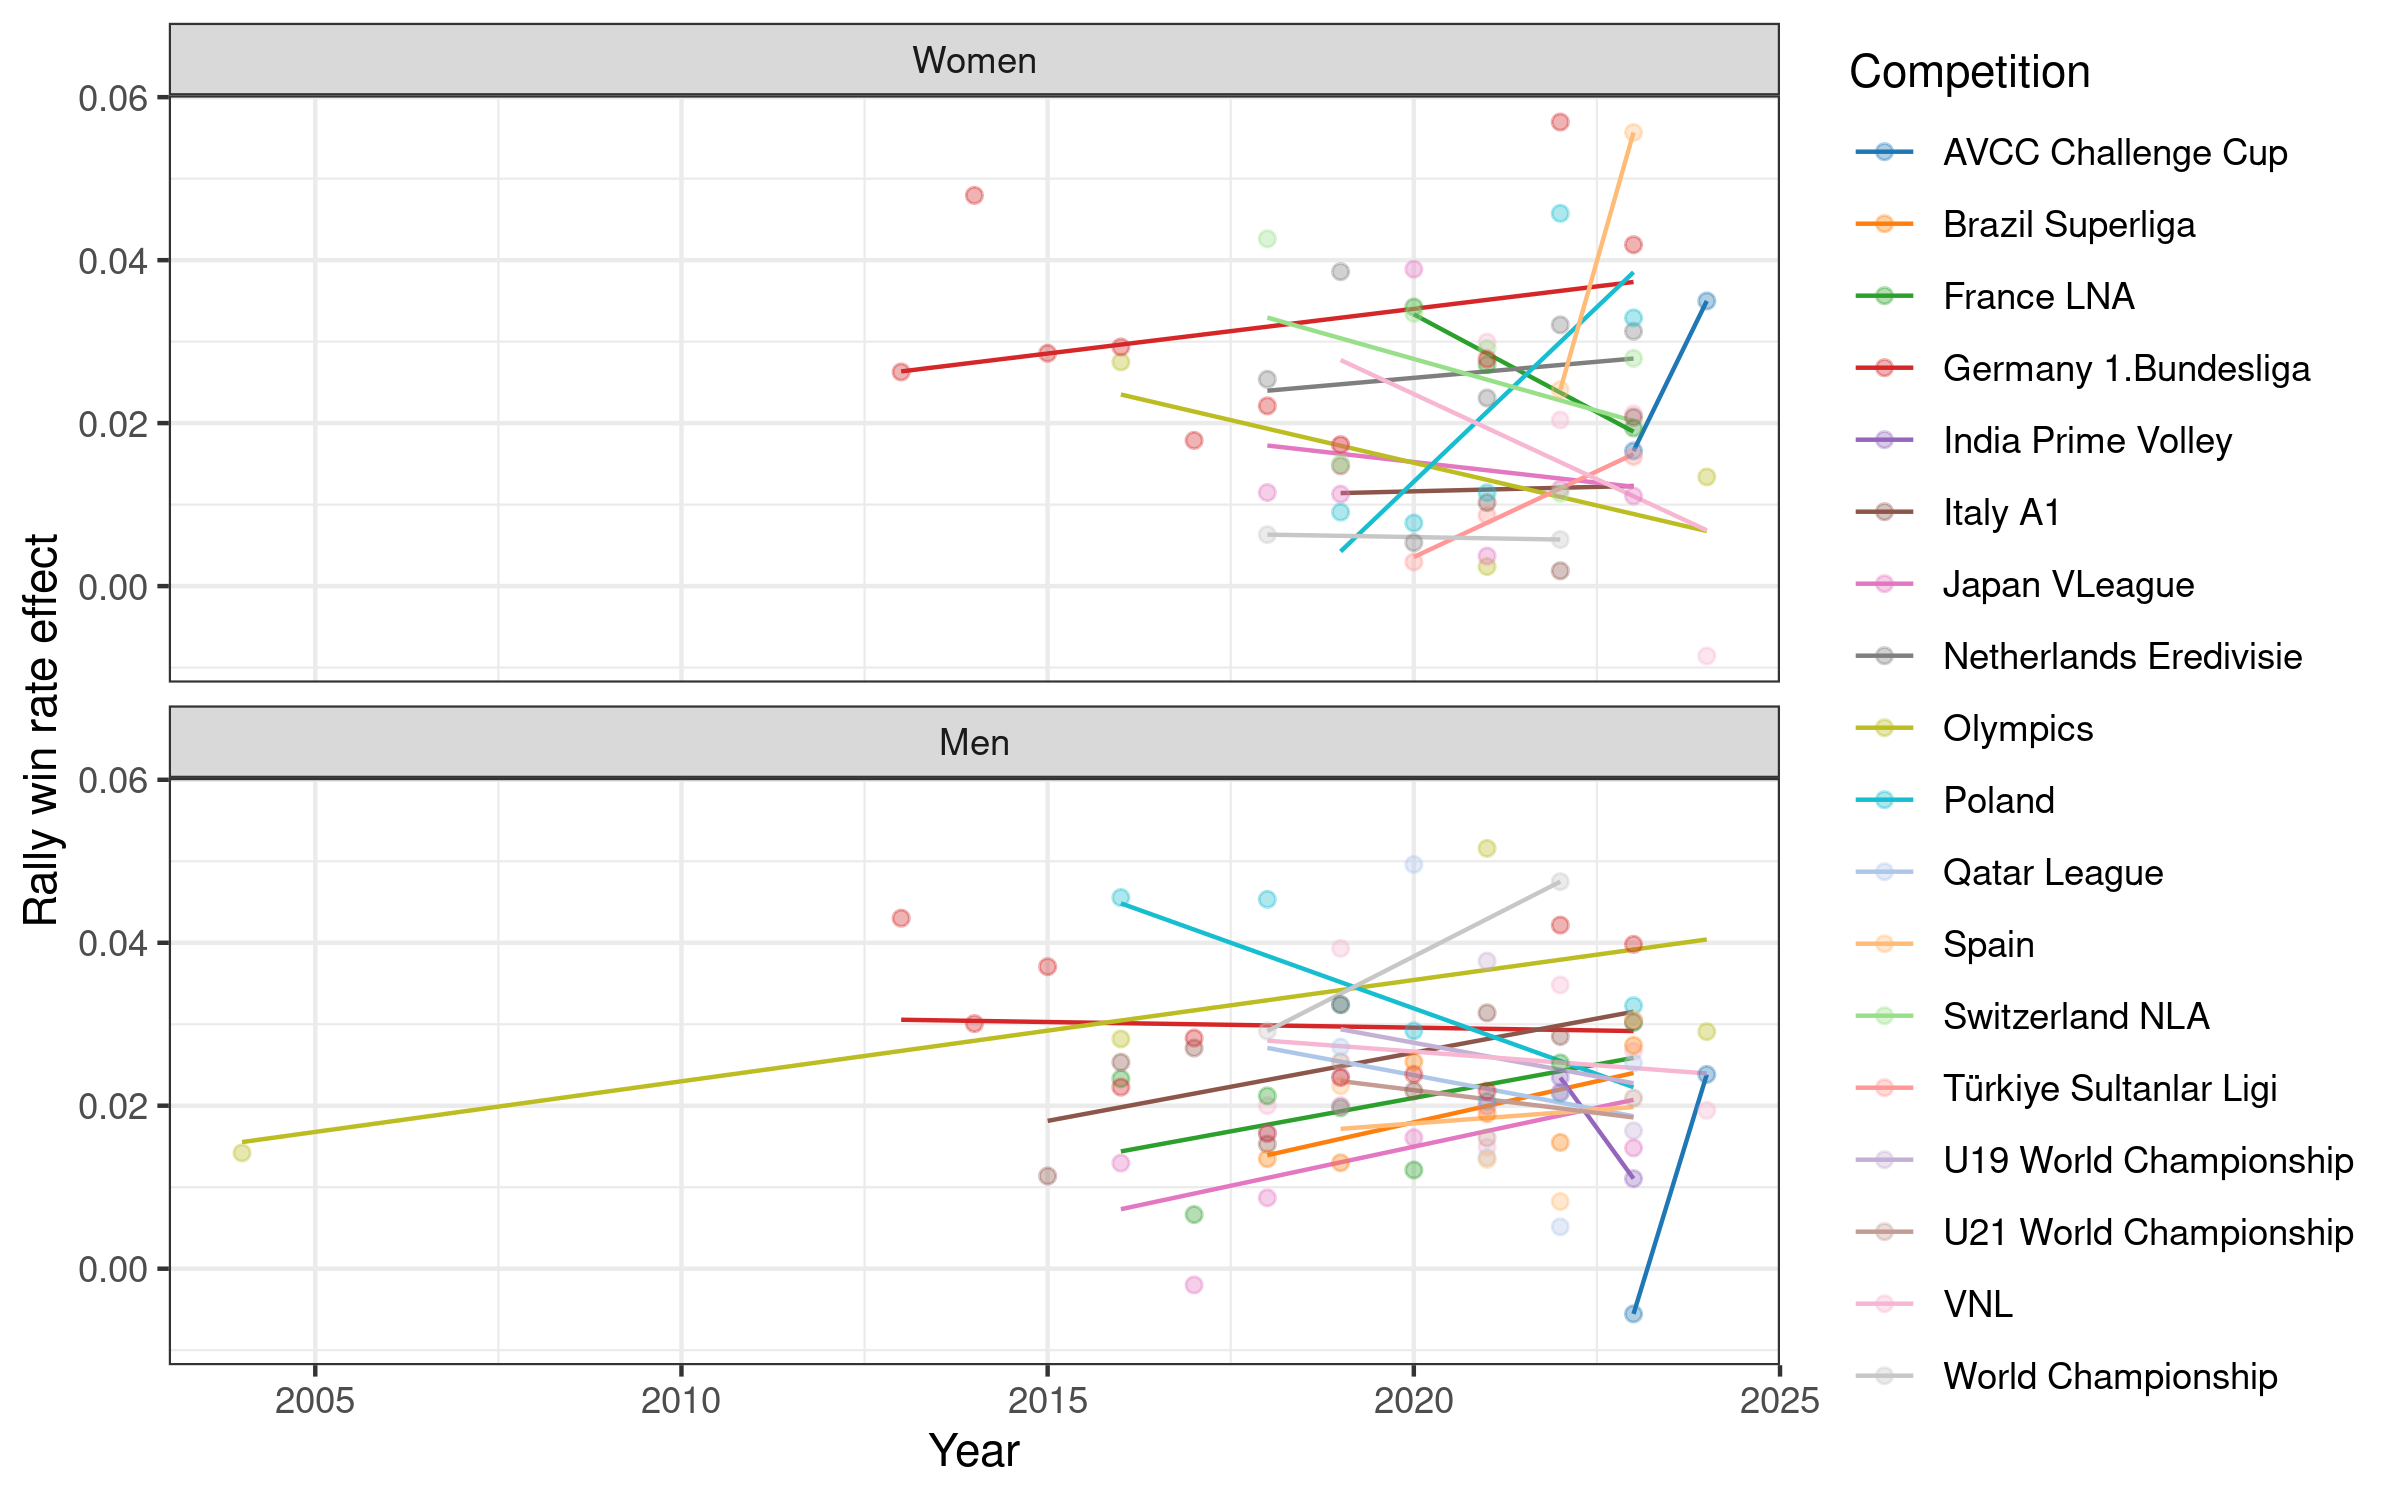
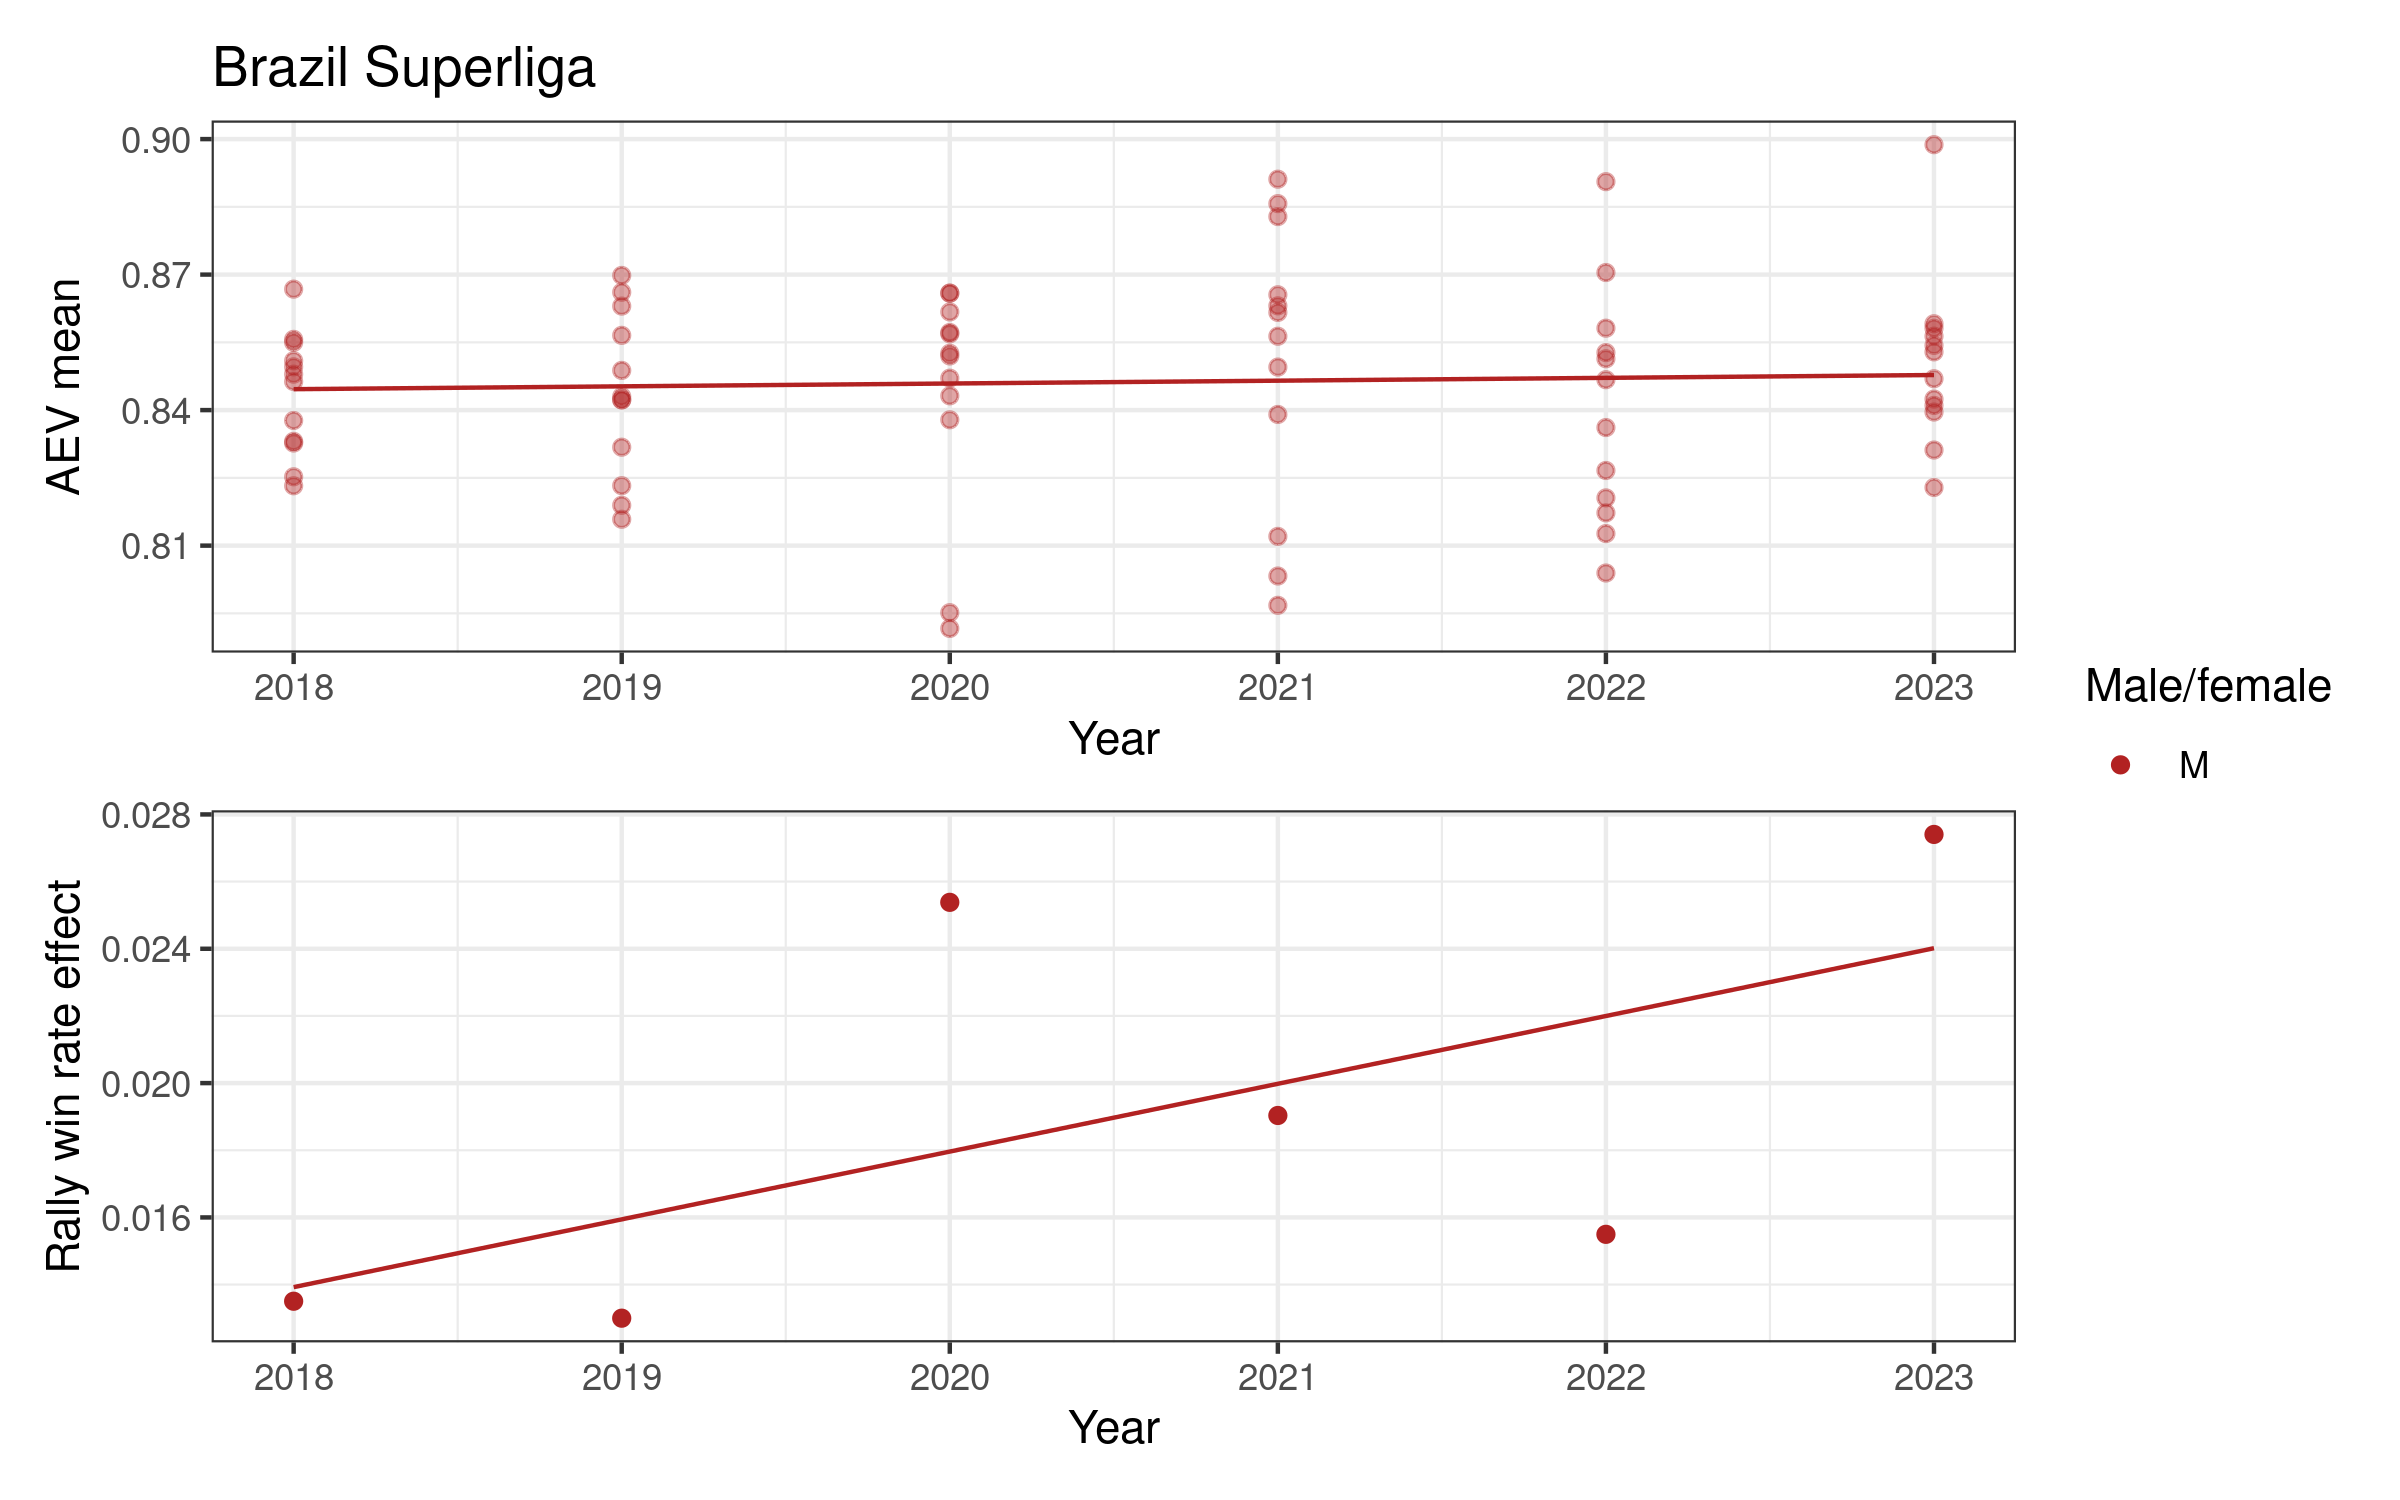
Rally win rate effect is more variable over time. For women it is potentially increasing in Germany and Poland, both with relatively high values in the last two or three seasons. For men there is a slightly more consistent pattern of increase in many competitions, e.g. in Brazil, France, Italy, and Japan, but decreasing in e.g. Poland, Qatar, and the VNL.
More detailed plots for each league are shown in Appendix 2, below.
Results: Global trends
Finally, we combine all of the men’s data sets into one, and look to see if there is a consistent long term trend. Indeed, we find that attack evenness has increased men’s competitions by about 0.001 per year (this is statistically significant). There was no significant trend in men’s rally win rate effect, nor in attack evenness or rally win rate effect for the combined women’s competitions.
Appendix 1: Methods
Attack evenness
The calculation of attack evenness is explained in the previous article. Since that first article we have modified the calculation method slightly, so that each lineup’s results account for the rotations (setter positions) that they played. This gives more accurate answers for lineups that did not play equally across all 6 rotations. But otherwise the overall method is the same as previously described. Values are first calculated for each lineup used by each team, on a match by match basis. From these values we can calculate an average attack evenness value for a given team in a given competition, or an average evenness for a whole competition. Refer to the previous article for details of the calculation method.
The calculation requires knowing player roles (e.g. middle hitters, because they are only on court for 3 rotations out of every 6). The player roles encoded in the scouted rosters are often incorrect, and so for this article we instead assumed that all teams used a setter-hitter-middle rotation (i.e. when the setter is in position 1, the players in positions 2 and 5 are outside hitters and the players in 3 and 6 are middle hitters, with the back-row middle replaced by a libero).
Rally win rate effect
We are interested in the relationship between attack evenness and
rally win rate. For each competition, we calculate the attack evenness
of each lineup in each match as described above, along with the number
of rallies they played and how many of those rallies they won. We then
fit a statistical model (as we did in the previous article, although the model has
been refined very slightly here). The model is a binomial generalized
additive model that includes random effects for lineup and
opposition team, along with a smooth term for
attack evenness. In plain(er) language, the model allows
for three sources of variation in rally win rate: each lineup has an
average rally win rate, each team has an average impact on their
opponent’s rally win rate, and rally win rate is allowed to vary as a
smooth function of attack evenness. If rally win rate is not associated
with changes in attack evenness, that smooth function will be a flat
line when the model is fitted to the data.
Once fitted, we use this model to estimate the expected rally win rate for attack evenness values of 0.75 and 0.90, and take the difference of those two. This value, which we call the rally win rate effect, is the estimated change in rally win rate associated with an increase in attack evenness from 0.75 to 0.90. A positive value for rally win rate effect means that rally win rate is expected to increase with that increase in attack evenness.
Note that we calculate one rally win rate effect per competition, using all teams and all lineups in that competition. (In principle it would be possible to calculate a rally win rate effect for each team in a competition, but in practice that is difficult because of the limited data available for any one team. Each model would need to be carefully inspected, which is impractical for the number of teams in this data set. We have not calculated rally win rate effects for individual teams here.)
Appendix 2: Individual competition plots over time
Each competition has a two-panel plot: the first shows attack evenness, with a point for each team in each year, and an overall indicative linear trend. The rally win rate effect is shown in the second panel, with one point per year and an indicative linear trend. Women’s competitions are shown in blue and men’s in red (in some cases we only have one of the two, for others we have both men and women).