
Can we benchmark competition standards of play?
2025-06-24
Adrien Ickowicz, Ben Raymond
As we have tried previously, defining competition standards is not an easy task, in particular because of the completely tangled way that volleyball skills and actions mesh into one another. We can however start with some descriptive statistics, and see where this leads us to.
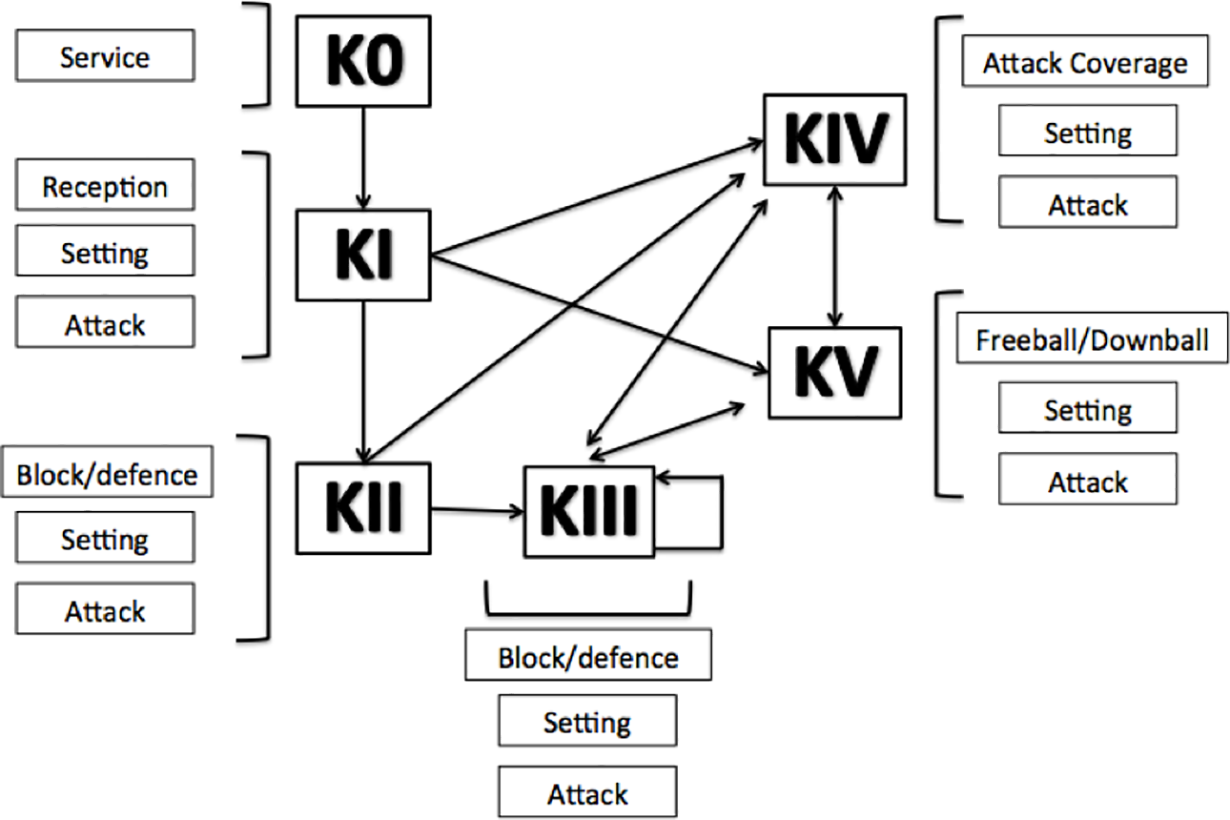
First, let’s have a look at the concept of complexes (the different facets of play in a volleyball match). The concept has changed since its inception to now include six distinct game complexes (see figure below):
- K0: Serve
- K1: Sideout - Reception; Set; Attack;
- K2: Sideout counter-attack - Block/Defence of sideout attack; Set; Attack;
- K3: Transition counter-attack - Block/Defence of sideout counter-attack; Set; Attack;
- K4: Attack coverage - Attack cover; Set; Attack;
- K5: Freeball/Downball - Freball/Downball; Set; Attack.
A quick query into your favorite websearch engine will show you that many researchers have looked into the correlation between the efficiency of these complexes and the likelihood of success. What we are proposing to do here is to look at these complexes in terms of fundamental skills with the hope to find some benchmark values to help guide the coaches’ reflection. One of the working hypotheses is that we might see different benchmarks for different leagues.
Let’s start with the data from the 2024 Olympics in Paris, on both the women and the men’s side. For each complex K0–K5 we assign each ball touch into one of three categories: the action resulted in a win (plotted in green), it resulted in a loss (orange/red), or play continued. Within each of those categories we further subdivide into fundamental skills.
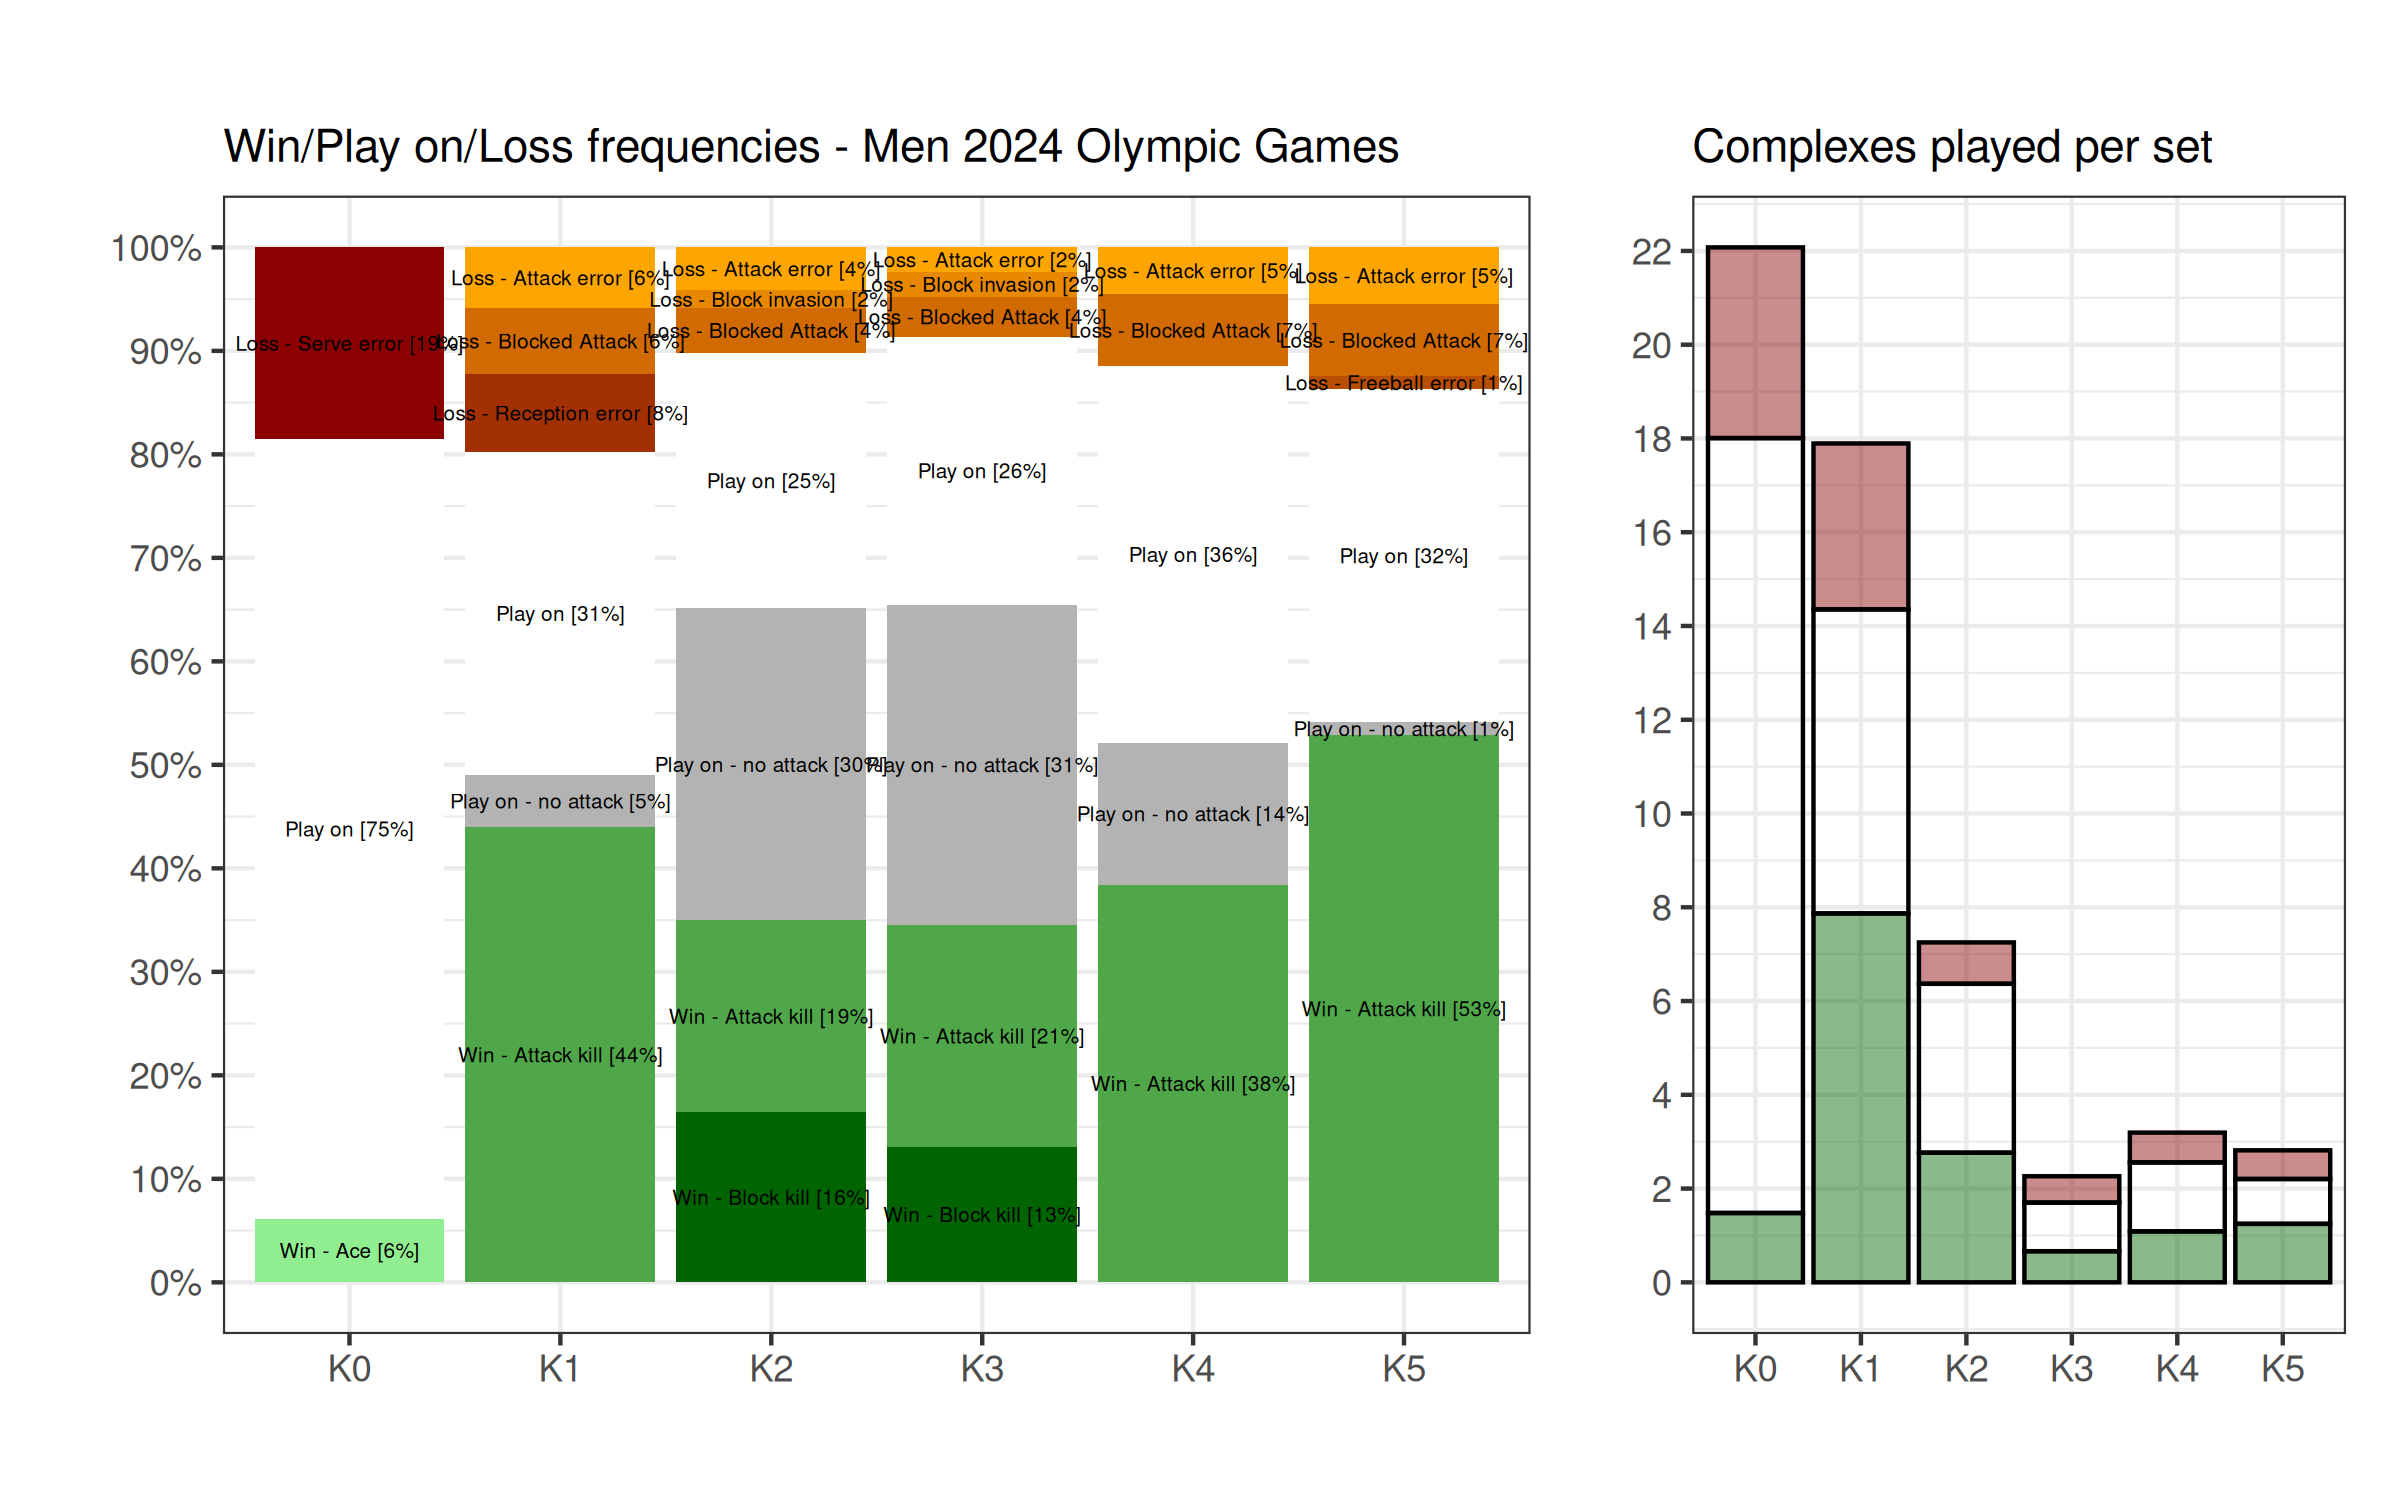
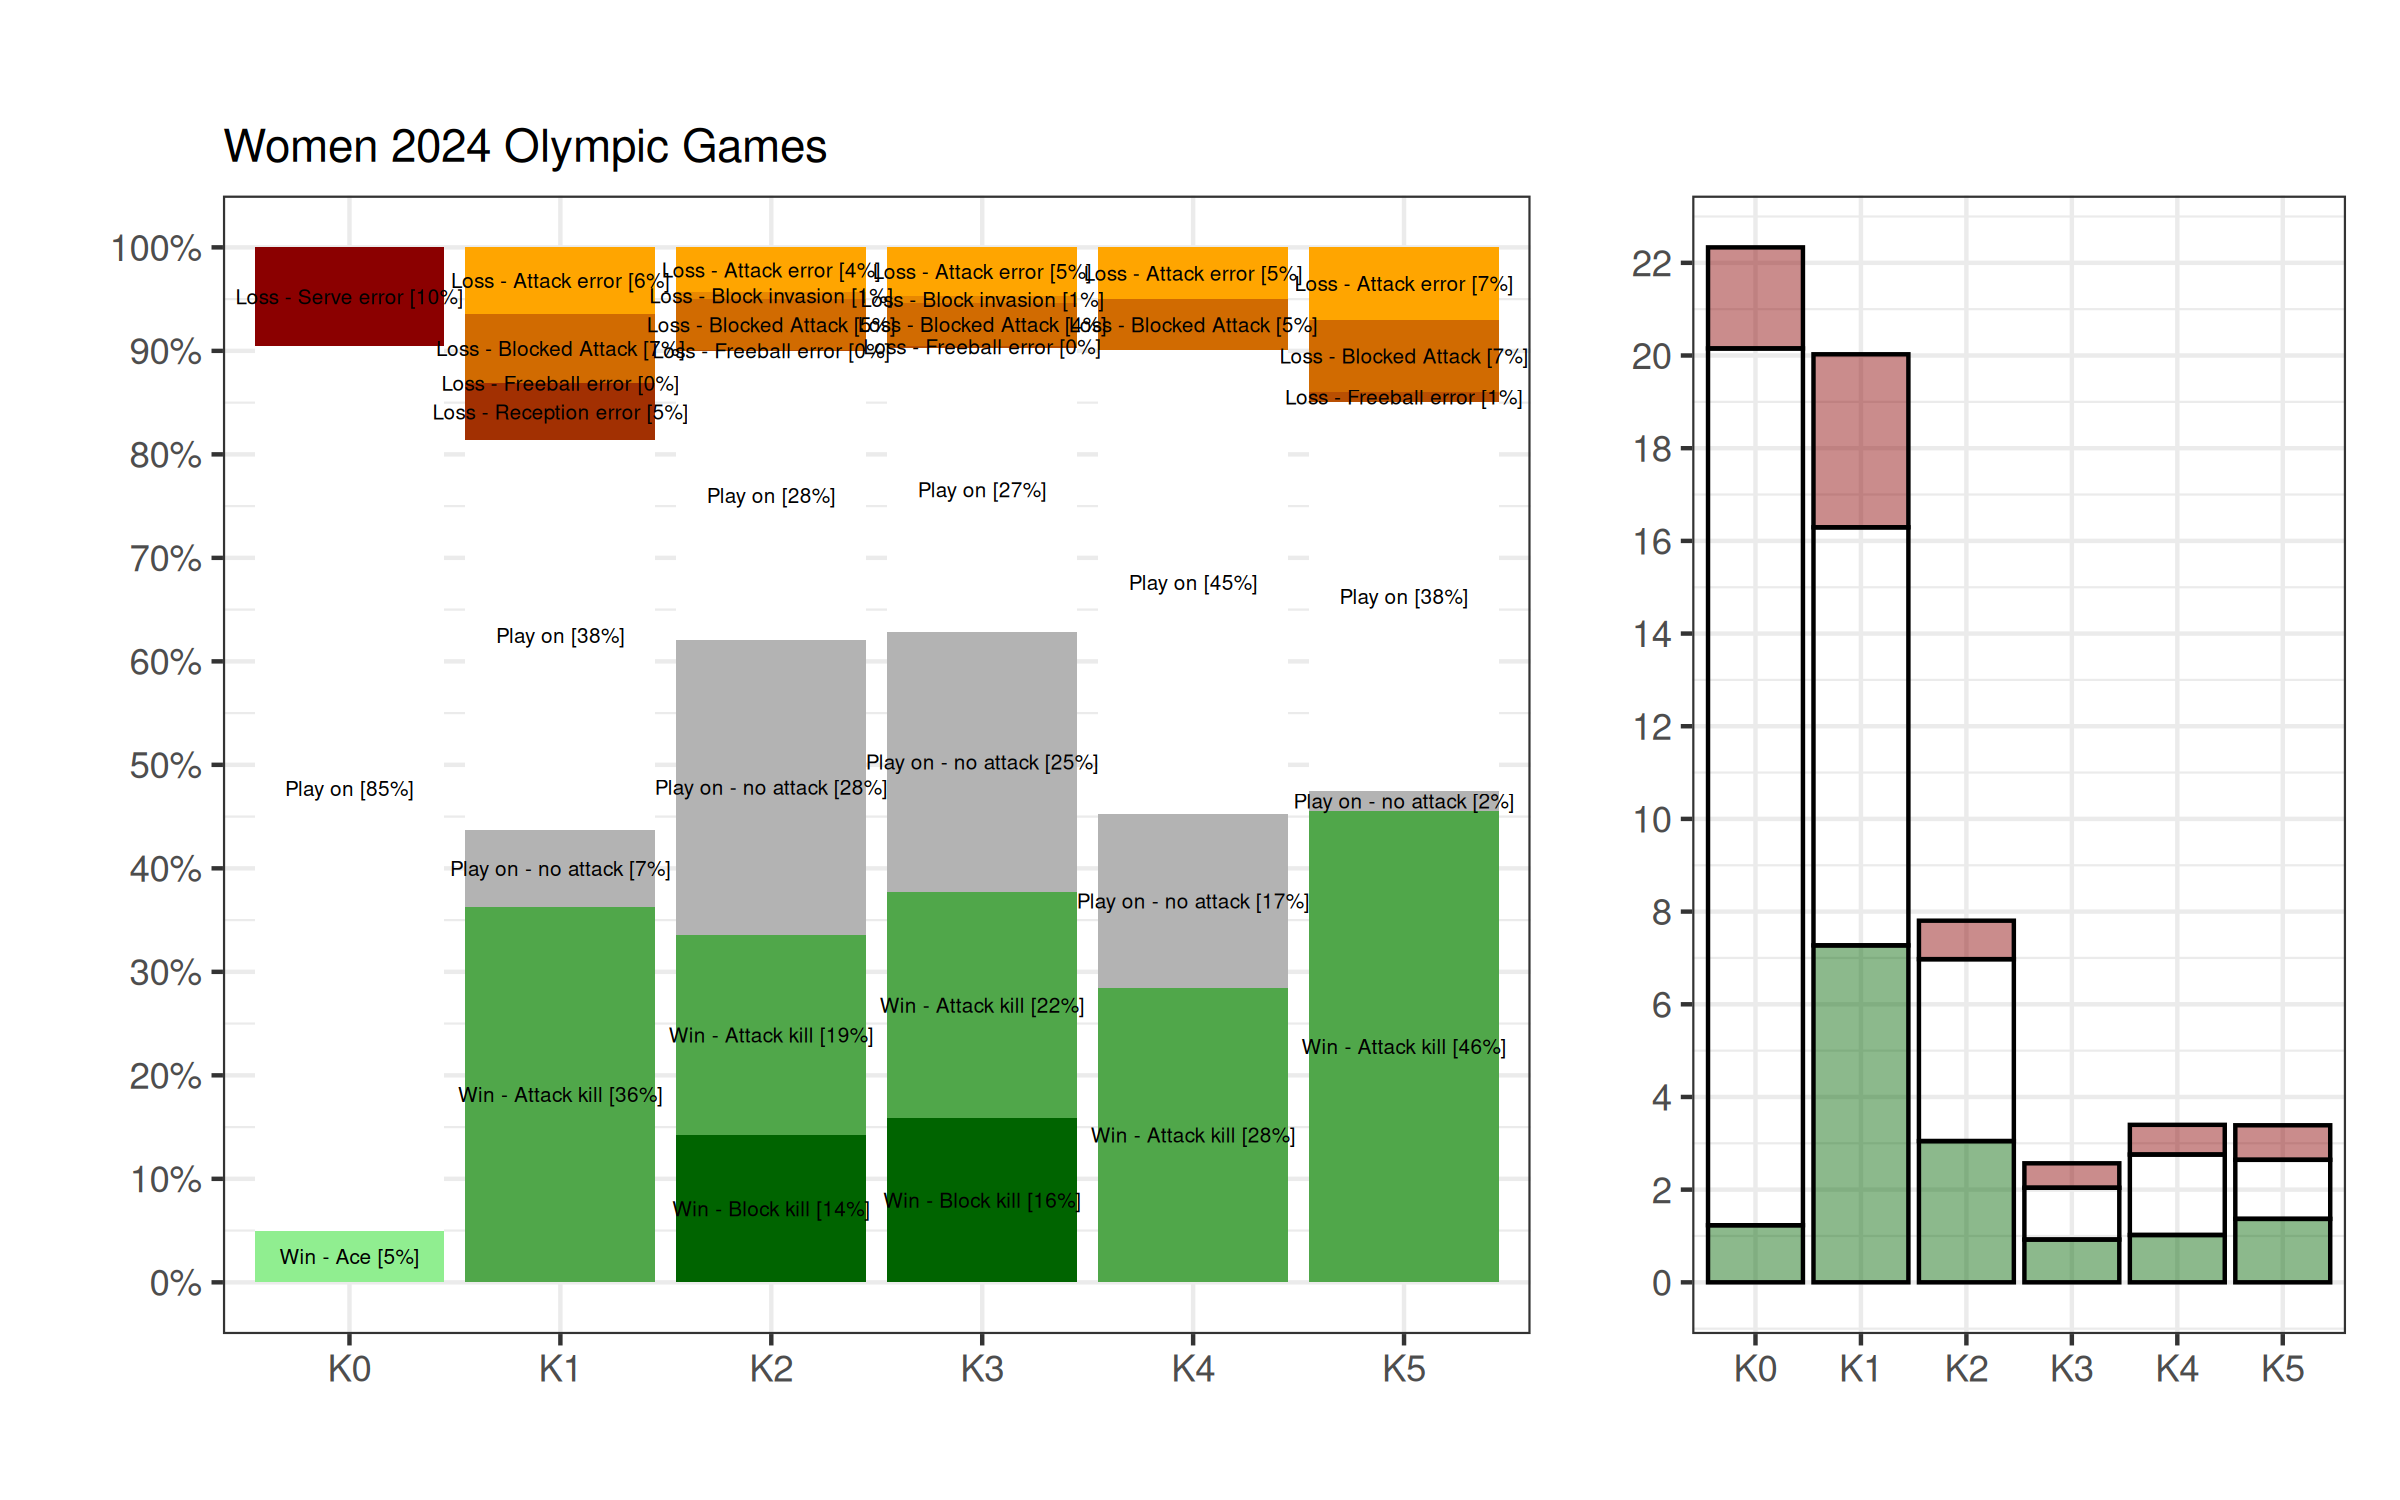
Not unsurprisingly, some logical observations can be made here:
- The first three complexes (K0, K1) are by far the most often played during a set of volleyball (on average);
- The women play two more K1 and two more K2 complexes per set on average, which is directly linked to more serves staying in play (85% vs 75%), and a lower attack kill percentage in FBSO phase (36% v 44%);
- The women play one more K2 and K3 than men on average (eleven per set instead of nine per set — total), but about the same amount of K4 (attack cover; three per set) and K5 (freeball/downball play; three per set);
- The men give away four points per sets on serve errors, while the women give two, for the same amount of points scored through aces;
- The men score eight points (out of eighteen plays) per set of K1, against seven (out of twenty plays) for the women. If the men were playing twenty K1 (less serve errors) then they would score nine points, meaning that serve errors and FBSO end up balancing out;
With that in mind, we will try to go a bit further in our analysis. What does it take to improve these numbers? And if we break down these complexes into individual skills, how well does a player need to do to help their team win a set? If you are familiar with the Science Untangled suite of tools, you know that we are computing a lot of variables that relate to the state of the game, such as kill and error rates and skill execution quality in different phases of play. So our idea was to use these, and check whether some were more important than others in helping win games.
How do we do that? We use a statistical technique called random forests that helps us identify what makes the difference between a winning team and a losing team. Yes, points scored on the scoreboard is key. But can we break it down further?
Ok, so here is an example of how we do it, using data from just two matches. We calculate our “game state” variables across each set (only a few are shown here) and relate them to set win or loss:
| set_number | set_won | ACE% | SERVE %ERR | REC %POS+PERF | ATT KILL% |
|---|---|---|---|---|---|
| 1 | FALSE | 0.0 | 29.4 | 57.9 | 30.4 |
| 2 | FALSE | 4.3 | 17.4 | 65.0 | 37.0 |
| 1 | FALSE | 4.3 | 21.7 | 50.0 | 55.6 |
| 2 | FALSE | 3.8 | 26.9 | 50.0 | 58.6 |
| 1 | TRUE | 12.0 | 24.0 | 66.7 | 52.4 |
| 2 | TRUE | 4.0 | 20.0 | 42.1 | 40.6 |
| 1 | TRUE | 0.0 | 20.0 | 33.3 | 52.0 |
| 2 | TRUE | 7.7 | 15.4 | 42.1 | 47.6 |
What we observe is that:
- With an ATT KILL% over 50%, you have 50% chance of winning a set (two sets won and two sets lost with above 50% KR);
- An ACE% of 4.5% or above yielded a 50% of winning a set (same reflection as above for ATT KILL);
- REC% POS+PERF did not yield a significant result, as the PERF+POS reception rates where mostly above in the lost set than in the won sets;
- SERVE ERROR is as insignificant as REC% POS+PERF based on the table;
So, in this example, ATT KILL % and ACE% mattered, while reception quality and serve error did not. When we do our analysis for real we follow the same general process, but for a lot more variables and a lot more matches and sets.
Complex benchmarks
So we applied this to the 2024 Men’s and Women’s Olympic games, and here are the results, for the complexes first:
Men
| Benchmark | ||||
| Competition set winning probabilities | ||||
| Set win rate1 | Average value1 | |||
|---|---|---|---|---|
| 1 Calculated when value is above/below benchmark | ||||
Women
| Benchmark | ||||
| Competition set winning probabilities | ||||
| Set win rate1 | Average value1 | |||
|---|---|---|---|---|
| 1 Calculated when value is above/below benchmark | ||||
The interpretation (for the men) is as follows:
- Winning the K1 complex (First ball sideout) is the most important factor, and needs to be at a rate higher than 50.0%;
- Serving an ace rate above 3.9% is also an important feature of the men’s game;
- Minimizing the loss of K1, that is minimizing attack errors, blocked attack, reception errors (ace), at less than 21.1% is the third most important factor;
and so on.
Skills benchmarks
Variable importance
This first set of graphs show the key variables ranked in order of importance. The higher the variable is, the more important it is. For instance, the most important element in both the men’s and the women’s game is the OPP ATT KILL%. In this example we have selected only thirteen variables, trying to keep elements that speak to each complex, and can be easily understood.
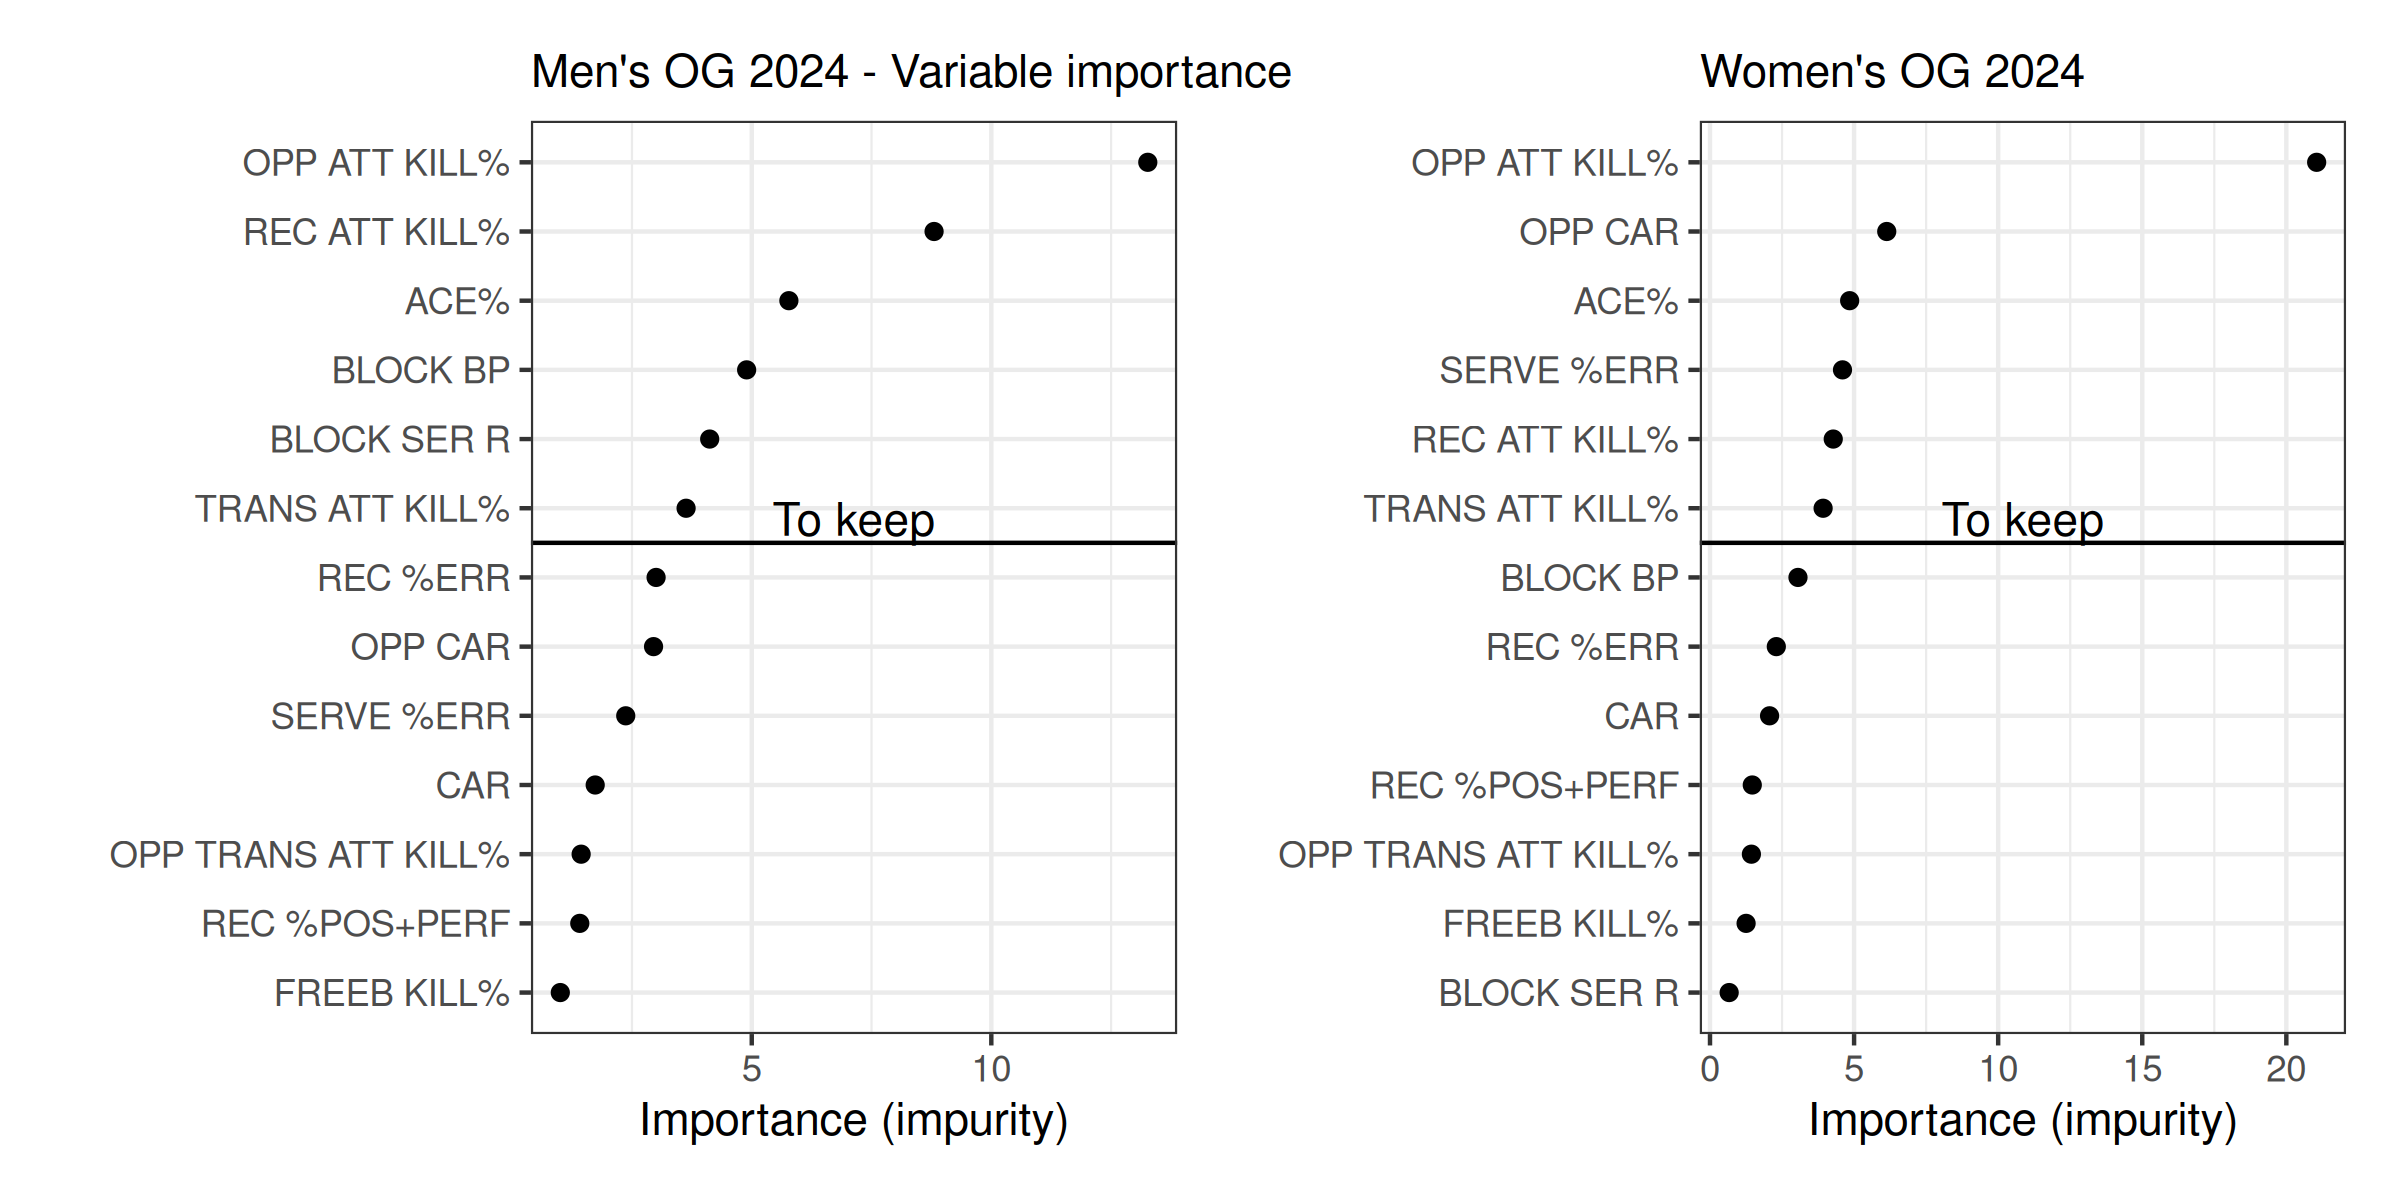
We could keep all of these variables for further analysis, but it usually pays to balance things and try to reduce to a core minimum, that you can really focus on to improve. If you are lucky with your analysis you might see a “jump” (or “cliff”, or “elbow”, all those terms are used) in the plot, with variables above the jump showing a marked increase in importance relative to those below it. A practitioner might choose to keep only the variables above the jump. Here we can see clear jumps after ACE% for men and OPP CAR for women, but using those as cutoffs would leave us with very few variables to look at. Instead, for parsimony (and example), we will keep the top six variables for the men and the women.
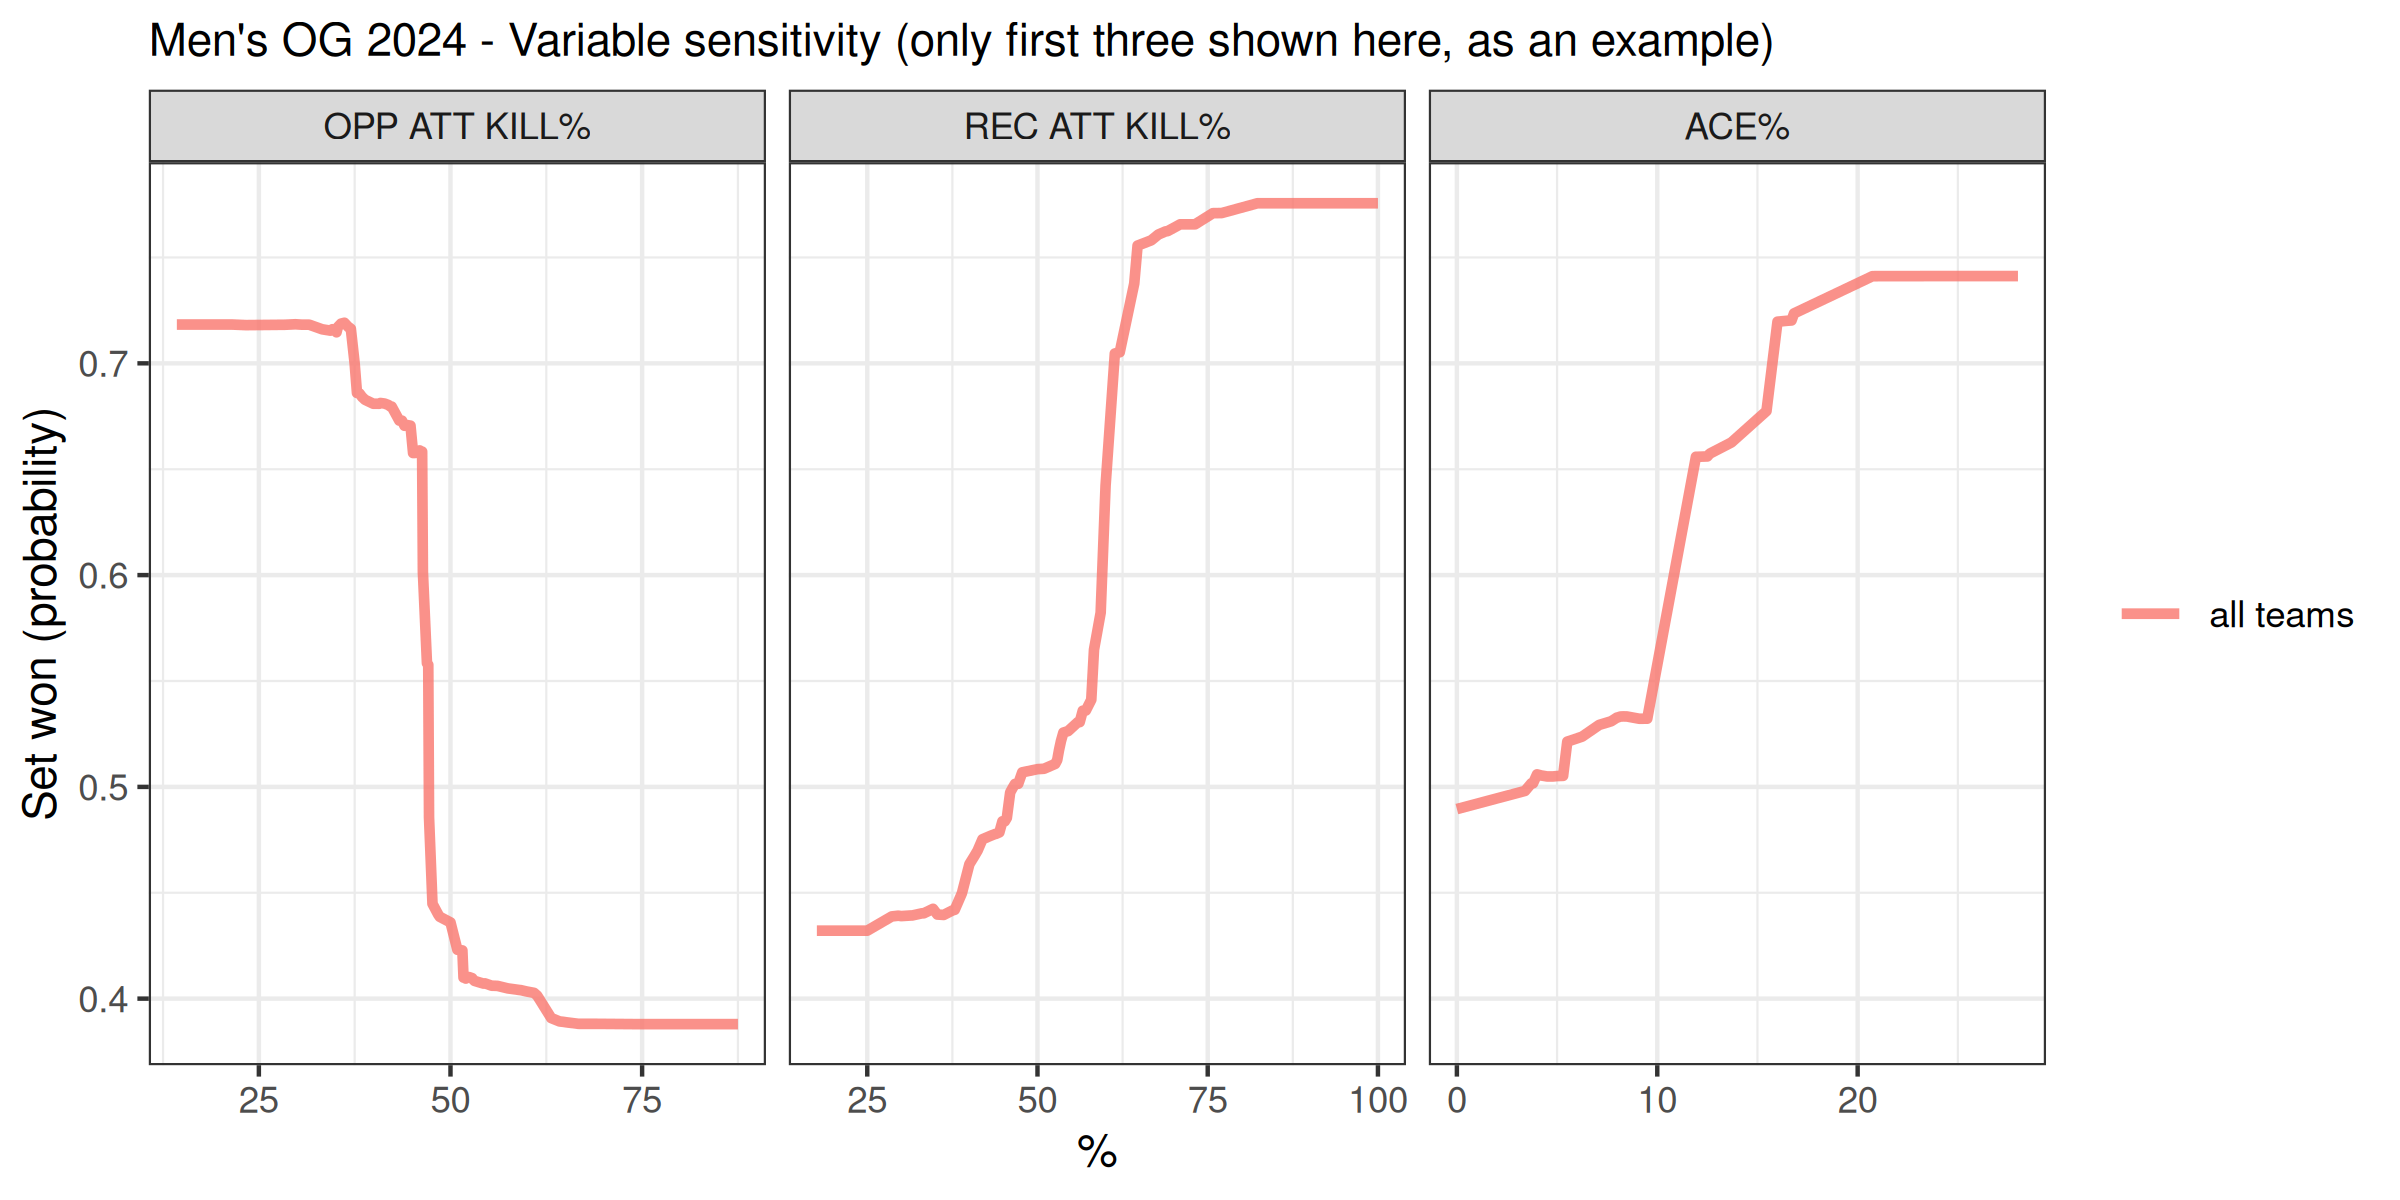
Benchmark values
Another added benefit of this approach is that we can ask the model what are the key numbers for each variable in order to maximise the chances of winning. The graphs below show for example what the sensitivity of the variables are for the men’s competition. In other words, if we look at the OPP ATT KILL% panel, we see a decreasing pink curve. The vertical axis describes the probability of winning the set, while the horizontal axis describes the range of the variable described in the panel. So we observe that OPP ATT KILL% can range from 13% to 88%, with the probability of winning the set being at 73% for low OPP ATT KILL% values, and 36% for high OPP ATT KILL% values. There is also a very steep region just below 50%, indicating that small changes in OPP ATT KILL% in this region can have a large impact on the probability of winning the set.
Based on this, we can consider as ‘benchmark’ the ensemble of variables and their values that give you at least 50% chance of winning a set. For the two competitions, and only keeping six indicators for ease of reading, this gives:
| Benchmark | ||||
| Competition set winning probabilities | ||||
| Set win rate1 | Average value1 | |||
|---|---|---|---|---|
| 1 Calculated when value is above/below benchmark | ||||
| Benchmark | ||||
| Competition set winning probabilities | ||||
| Set win rate1 | Average value1 | |||
|---|---|---|---|---|
| 1 Calculated when value is above/below benchmark | ||||
To the trained eye, there are differences in both the type of variables that matter, but also the benchmark value. For instance, REC ATT KILL% matters in both competitions, but needs to be higher than 46.4% in the men, and 29.9% only in the women. The main differences between the two competitions lie in the presence of the block variables for the men (absent in the women), and the SERVE %ERROR and OPP CAR (opposition counterattack rate) for the women (not as significant for the men).
Now we have to be mindful that these are aggregated indicators. By analyzing a single team instead, we may find out that a team’s success is a bit different to the competition benchmark because of how that particular team plays.
Importance over years / competition
Ok, now let’s check the ranking (and importance) of the different variables over the years / competitions. For the men’s game:
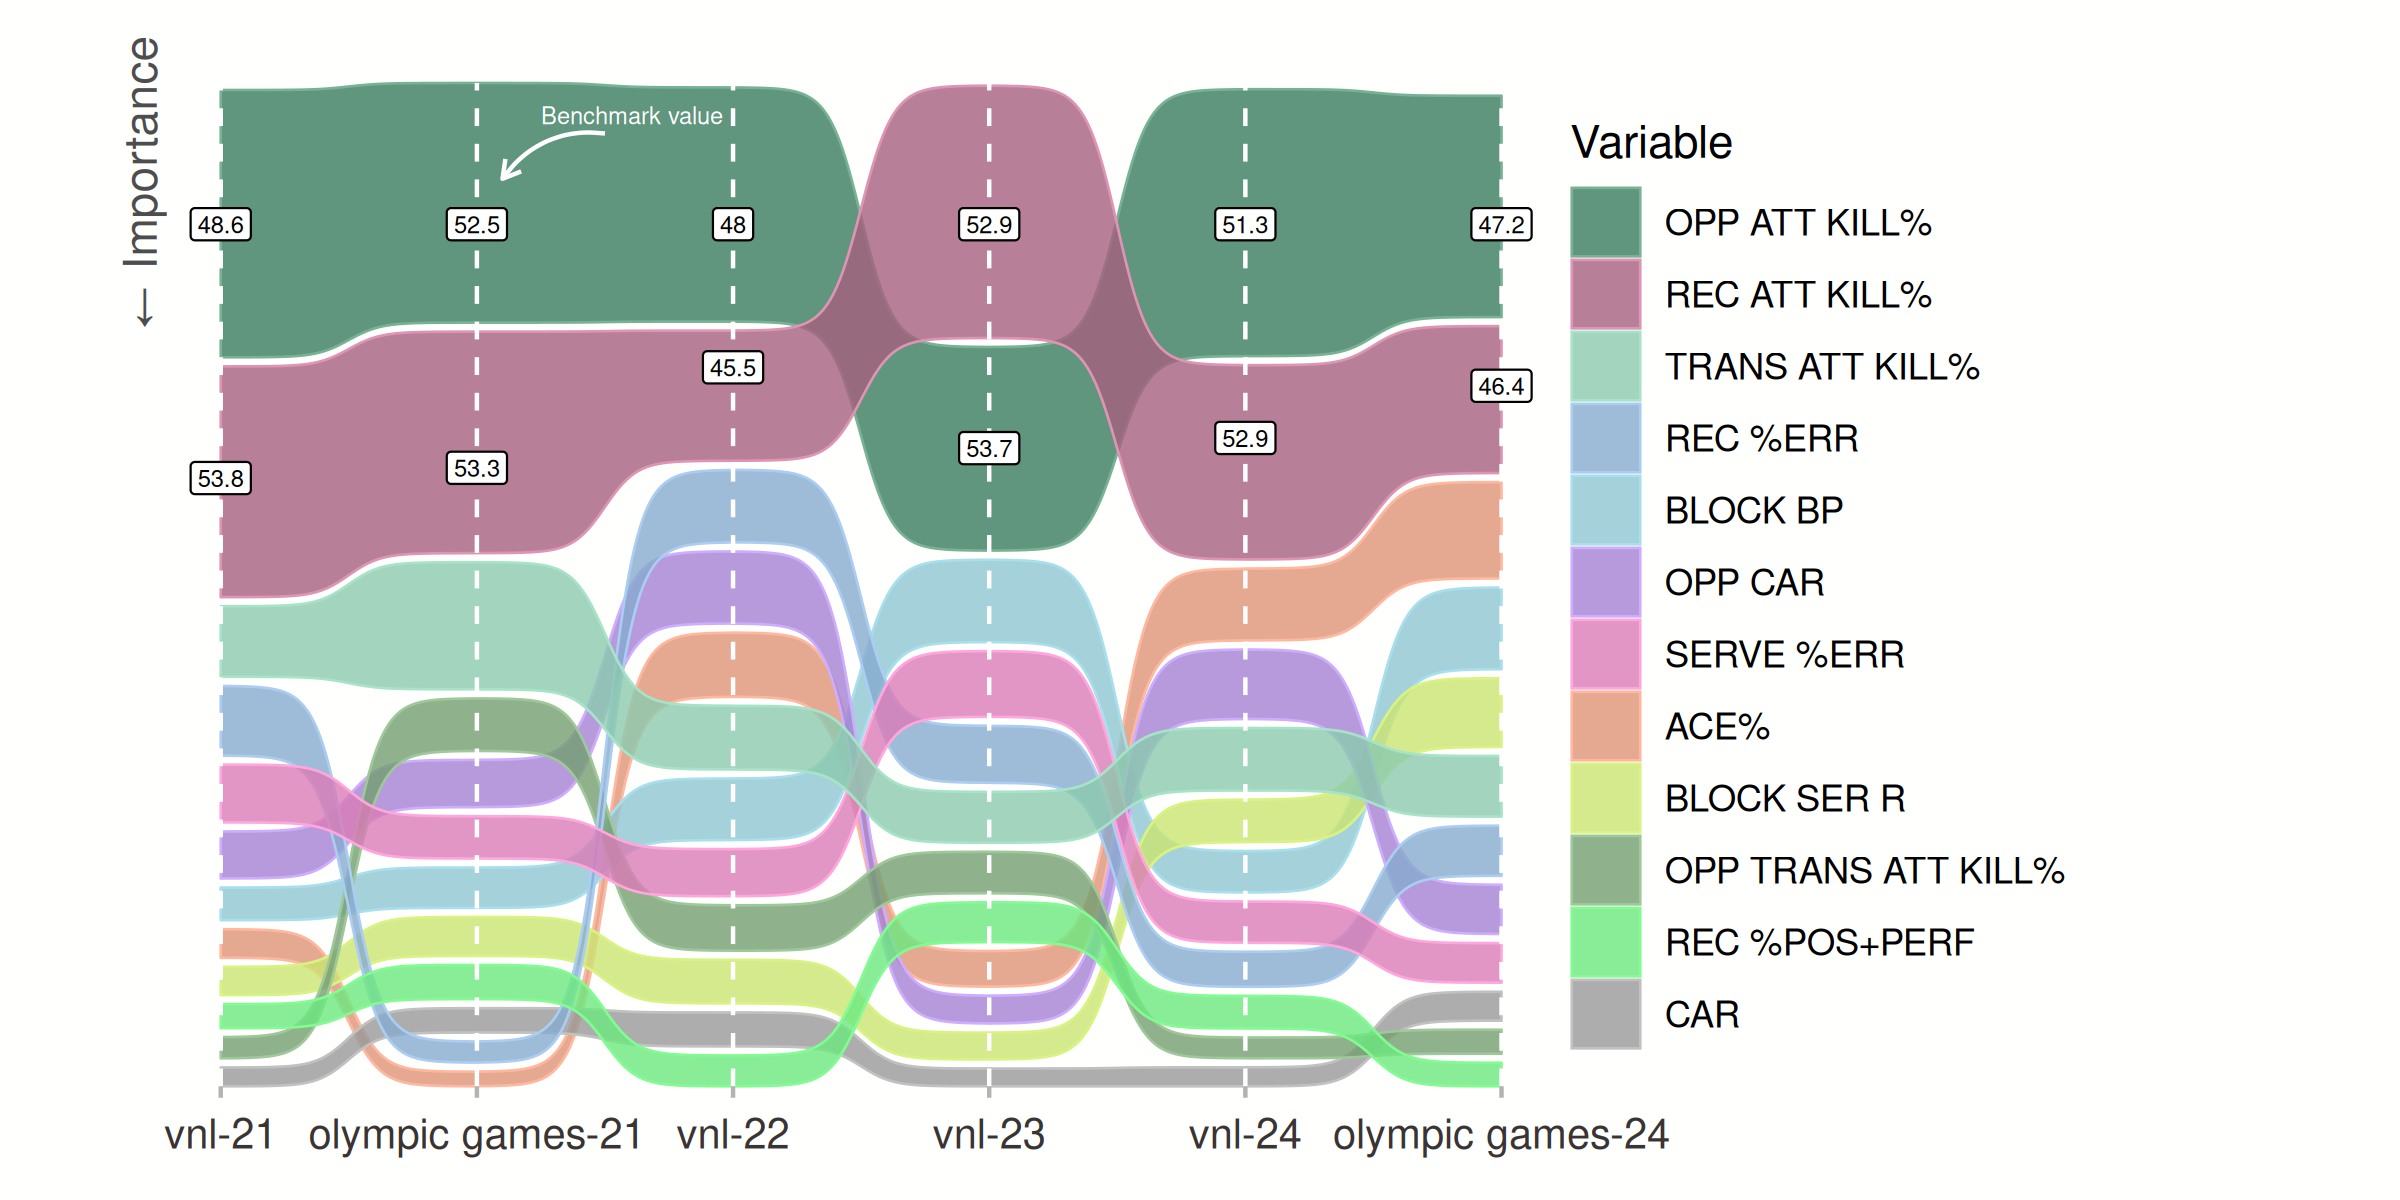
We can clearly observe the consistent importance of controlling the opponent kill rate, while at the same time maintaining a high kill rate off reception phase. The benchmark values are also quite consistent, hovering around the 50% mark. Some other trends, but to interpret lightly as it is only over three years:
- Decreasing importance of transition attack kill rate;
- Increasing importance of ace rate and block rate;
It will be interesting to see how these findings stack up against this year’s VNL and world championships. Stay tuned to see these tools being deployed on Science Untangled shortly!