
Comparing setters — implications
2019-04-02
Ben Raymond, Mark Lebedew, Adrien Ickowicz
Comparing setters - implications
In the previous post we looked at two different setter strategies: setting the “hot hitters” (as indicated by kill rate priority) vs setting with more variety across attackers (entropy and sequence entropy). Can we see evidence in the data that these two strategies lead to differences on court?
Number of blockers
A setter who uses their attackers evenly will be less predictable from one play to the next, compared to a setter who focuses on one or two main attack options. We might therefore expect that the number of blockers on each attack should be lower with a less-predictable setter.
We fit a statistical model1 to the number of blockers on first-tempo (1T) attacks, and use that model to estimate the probability that there was a multiplayer block on a first-tempo set by each setter. This modelling approach allows us to control for the opposing teams that each setter faced. Some setters might only have played against weaker blocking teams, for example, and if we simply looked at their raw data, their multiplayer block probability could be lower because of this bias. The model allows us to compare all setters on an equal basis, regardless of the teams that each played against.
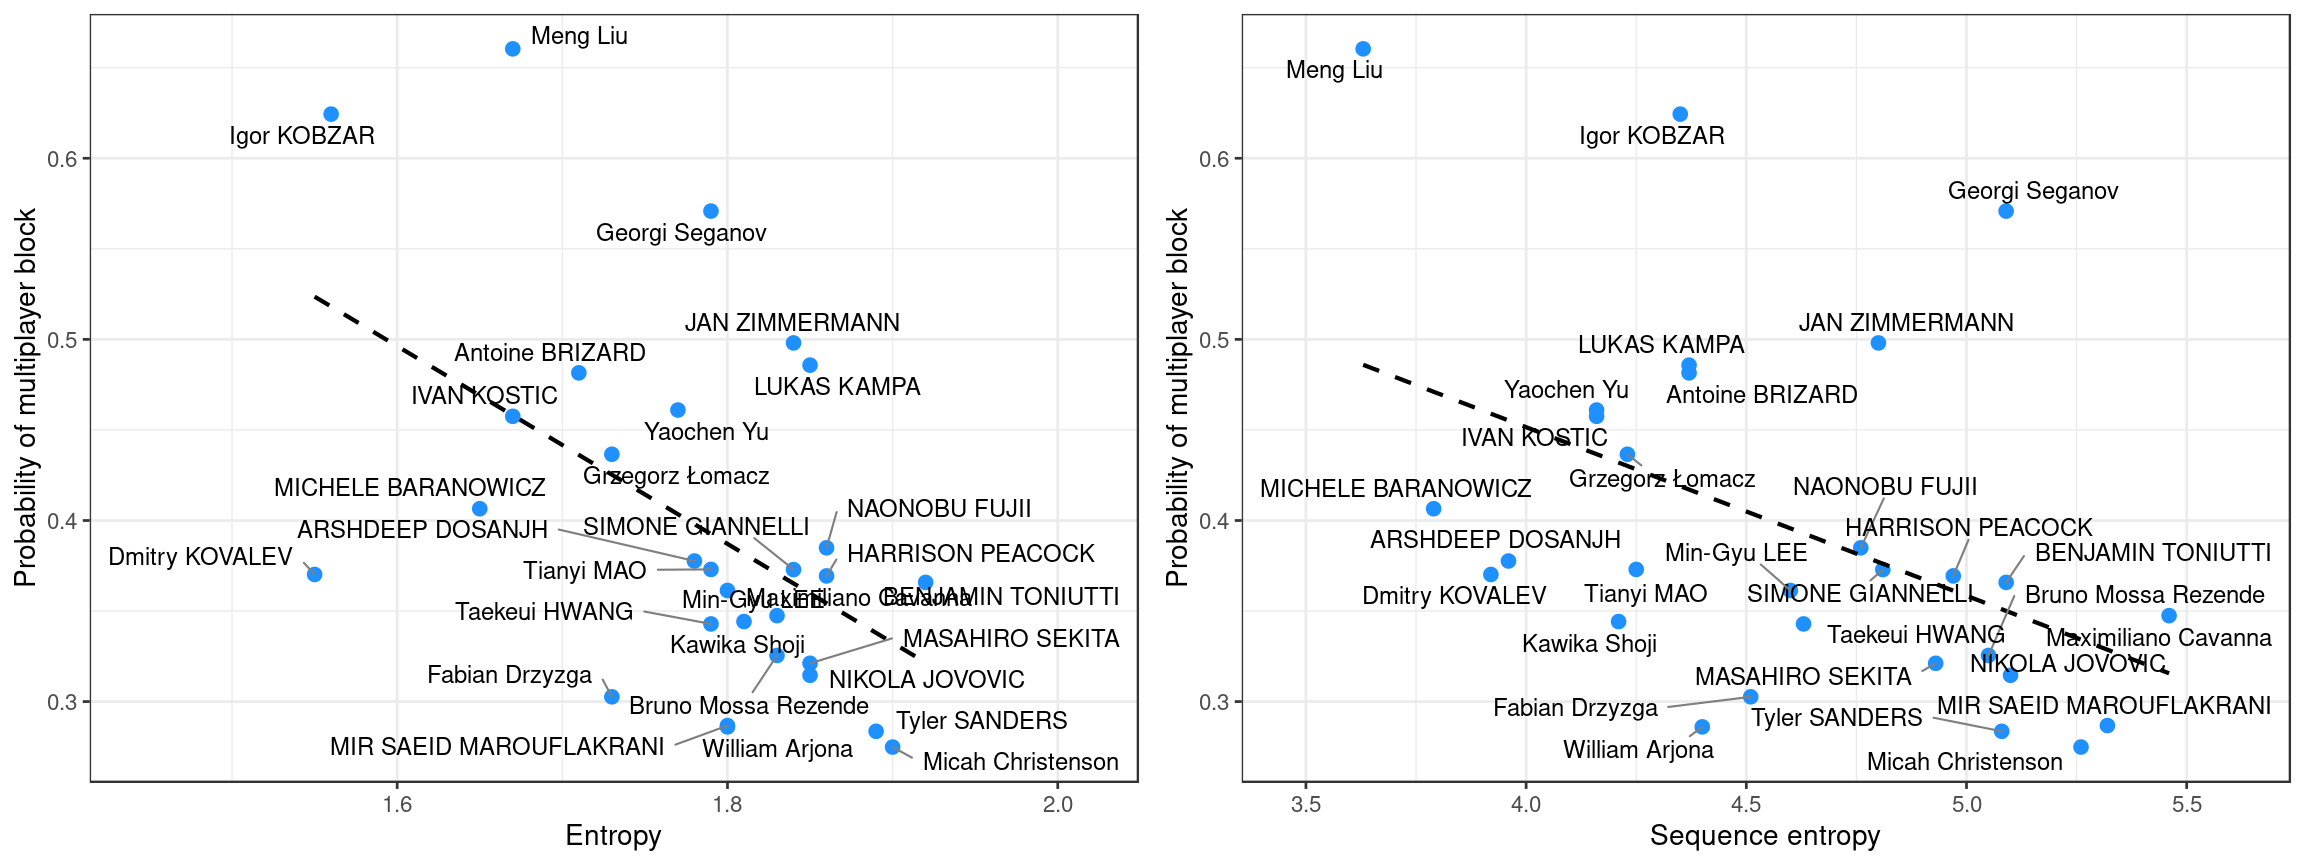
The graphs show that the probability of a multiplayer block is lower for setters with higher entropy and/or sequence entropy, as expected.
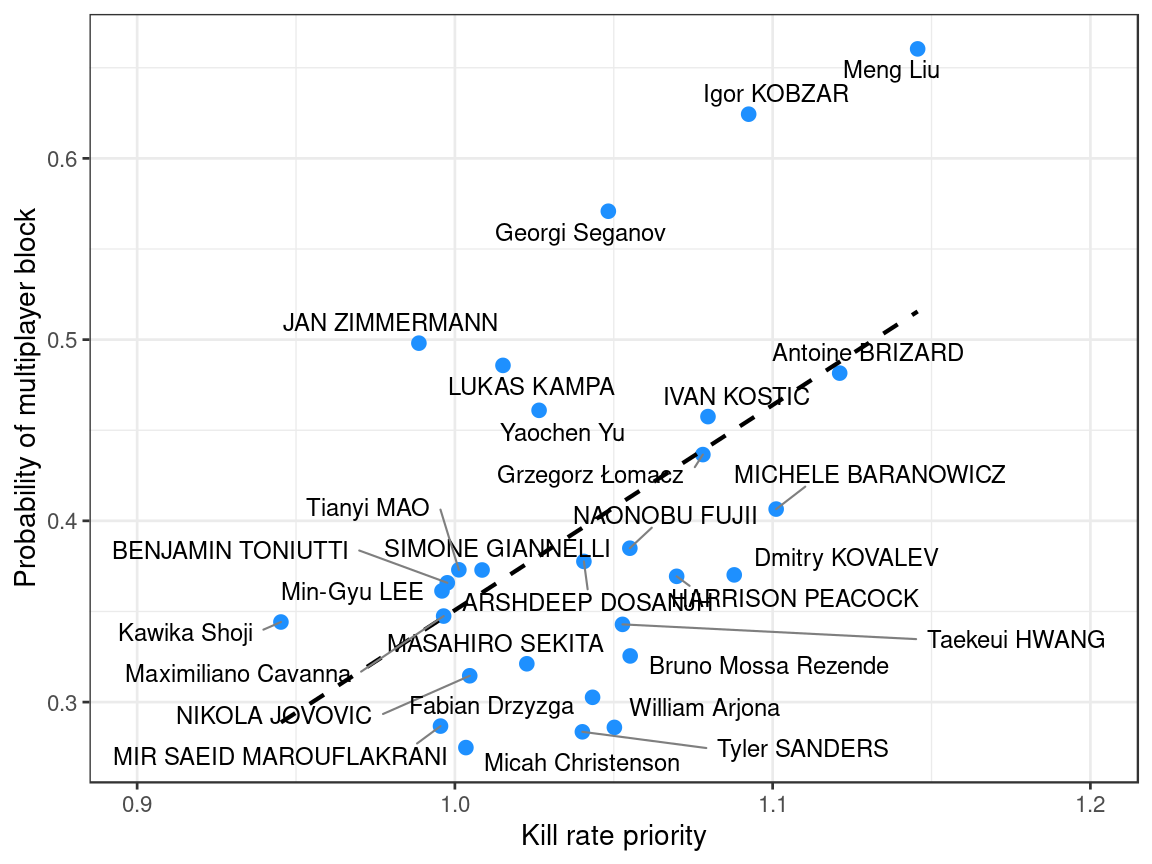
The relationship with kill rate priority (below) shows the opposite relationship: setters with a higher kill rate priority can expect a multiplayer block more often on their middle (first-tempo) attackers.
Using the number of blockers isn’t perfect — for one, the DataVolley scouting software doesn’t generally allow the scout to differentiate between a poorly-formed or well-formed block, and we would expect that some scouts would record a poorly-formed double block as a “double block” whereas other scouts might call it a “single player block”. But the results are nevertheless promising.
Match-to-match variability in setting distribution
A setter’s strategy should also be reflected in the match-to-match variability of their setting distribution. A setter with high entropy, who is using their attackers evenly, will tend to have a low match-to-match variability. These setters are more variable and less predictable from one attack to the next, but their overall distribution is likely to be more consistent from one match to the next. In contrast, a setter who tends to set the hot hitter is likely to have higher match-to-match variability, because the hot hitter will vary from match to match depending on the opposition blocker matchups and other factors. (There could of course be exceptions to these — for example, setters who have one or two consistently-effective attackers at their disposal might show low match-to-match variability in their setting distribution, because those attackers are consistently their go-to options.)
If we plot our three metrics against match-to-match variability …
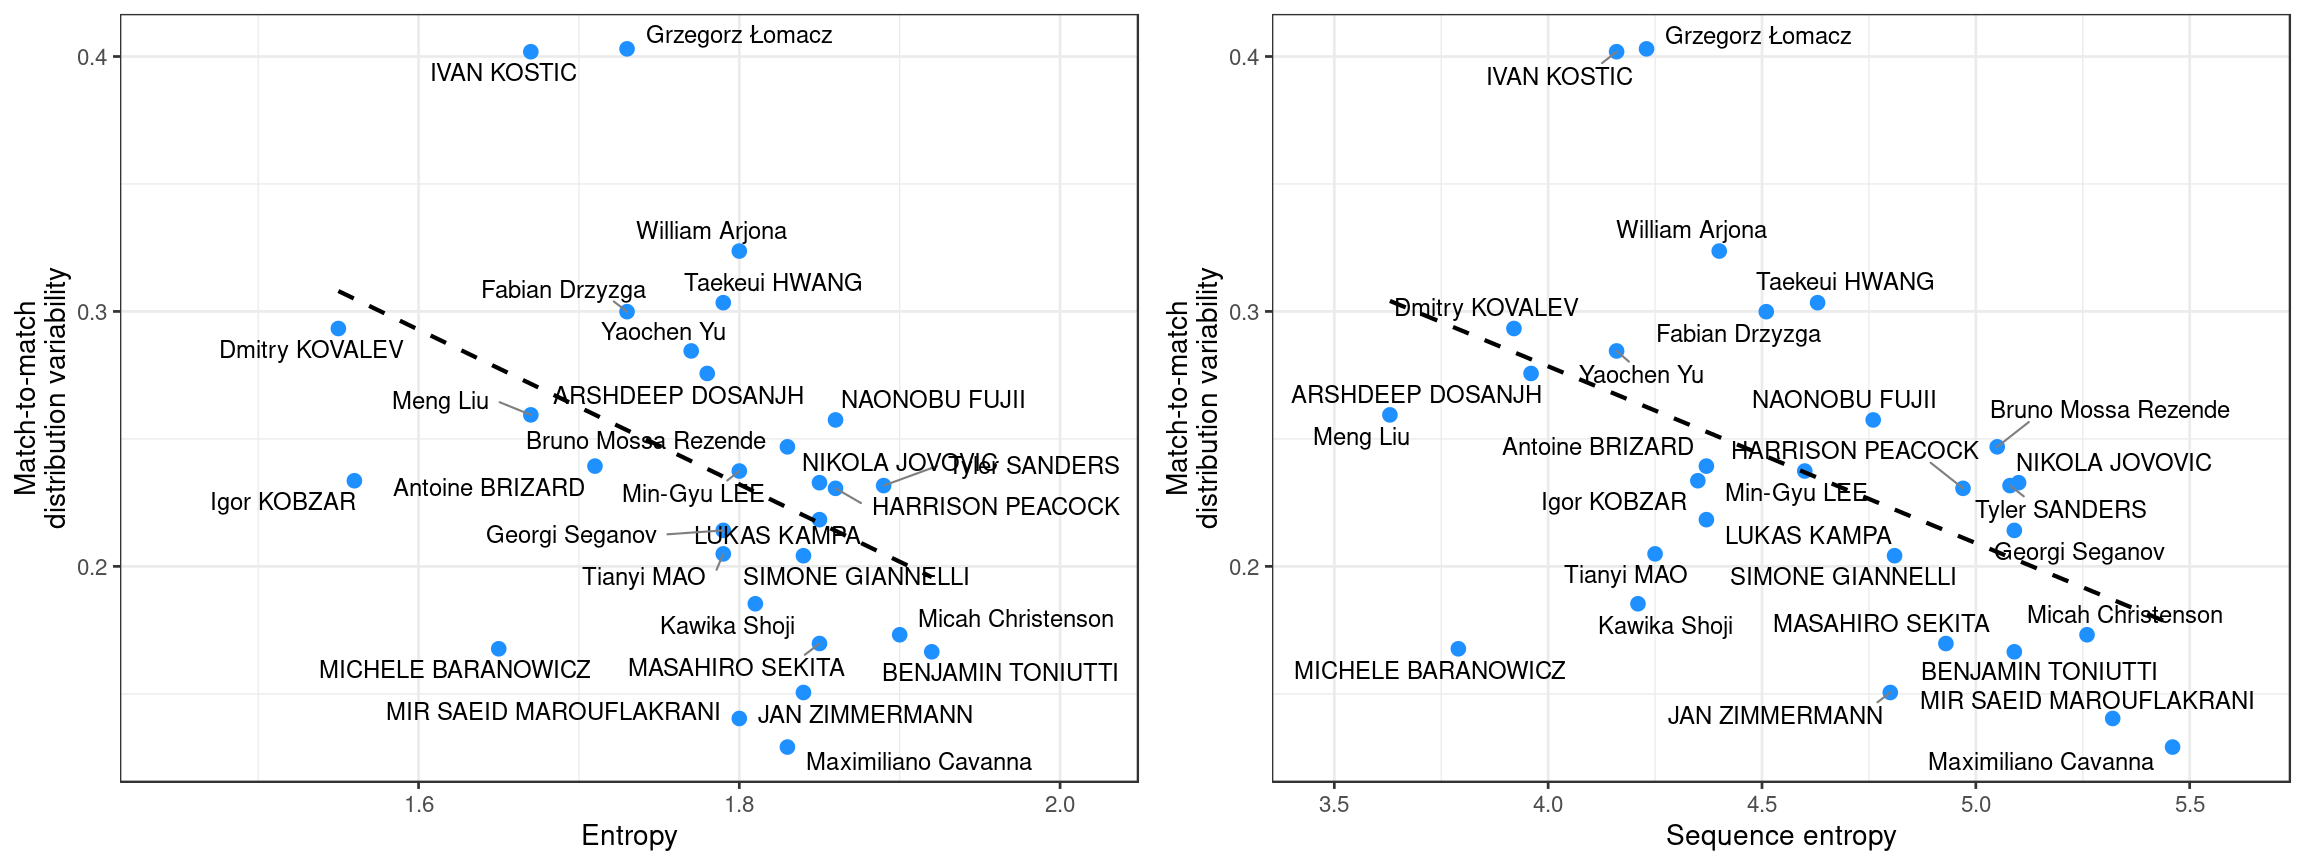
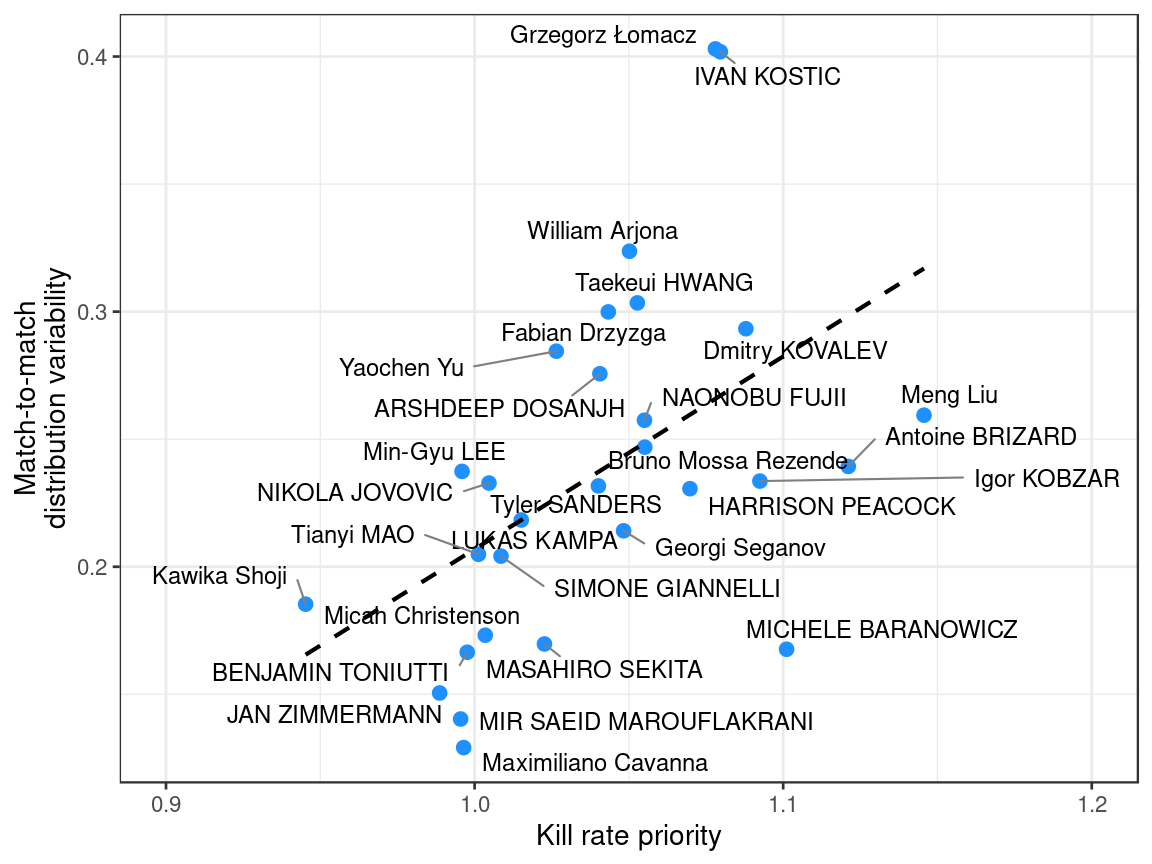
… we see that the overall relationships are as we expect: lower match-to-match variability for setters with high entropy, and the opposite for those with high kill rate priority.
Team differences
We conclude by repeating two of our previous figures, but this time using colour to indicate the different teams.
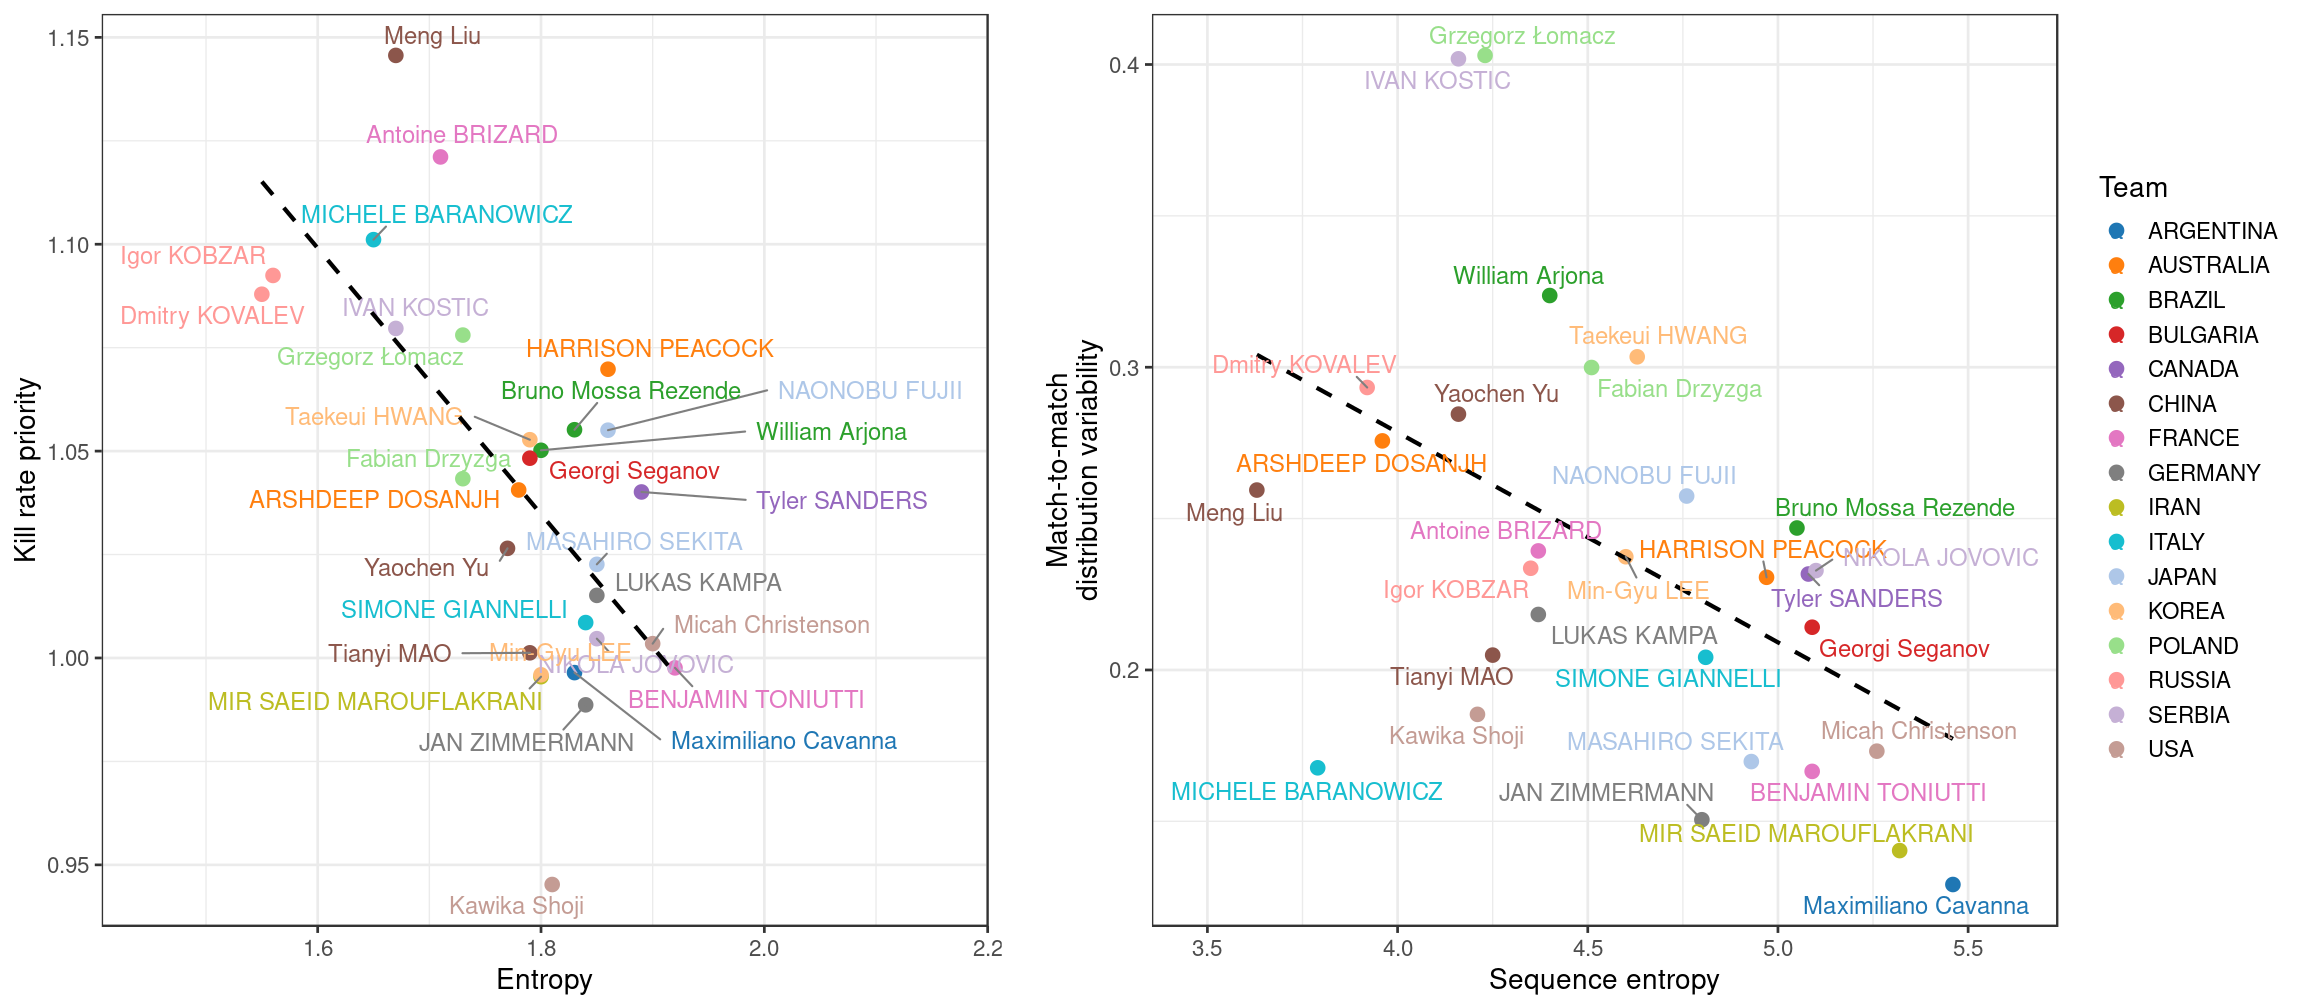
On the left-hand plot (entropy vs kill rate priority) in many cases the alternate setters on the same team tend to have similar characteristics. The Russian setters Kobzar and Kovalev, for example, both sit at the “hot hitter” end of the scale, with low entropy and high kill rate priority, while Zimmermann and Kampa (Germany) are the opposite. The Brazilian setters Bruno and William both show moderate entropy and kill rate priority, perhaps suggesting a hybrid strategy that blends variety with opportunistic use of hot hitters. We speculate that these two indices (entropy and kill rate priority) might be primarily reflecting team/coach strategy in these instances. However, we also note that this setter-within-team similarity was not always the case in this plot: see for example Toniutti (France), Giannelli (Italy), and Jovovic (Serbia), who each sit at nearly the opposite end of the scale to their counterparts Brizard, Baranowicz, and Kostic.
In the right-hand plot (sequence entropy vs match-to-match variability), the alternate setters on the same team do not tend to group quite so tightly. For example, Bruno’s sequence entropy was higher, and match-to-match variability lower, than William. Interestingly, the primary setter on each team generally showed higher sequence entropy than their counterpart — see e.g. Toniutti vs Brizard, Christenson vs Shoji (USA), or Peacock vs Dosanjh (Australia).
Summary
In these two posts we have presented some new approaches to characterising setter strategy (entropy, sequence entropy, and kill rate priority), and examined their relationships with number of blockers and match-to-match variability.
Further work will be needed to better understand the true utility of these approaches: however, the results have potentially interesting implications for scouting opposition setters and formulating defensive plans. A setter with low match-to-match variability is tending to use a similar overall setting distribution from one match to the next, and so should therefore be broadly predictable at this whole-match scale. However, if they also have high entropy (variety) then they tend to distribute their sets evenly across their attackers, potentially making them less predictable from one play to the next within a match (although they might still tend to follow particular patterns in particular situations). A setter with high match-to-match variability will have an overall distribution that is a-priori less predictable, potentially requiring a defensive plan that can adapt as the match unfolds.
Specifically, a binomial generalized linear mixed model using only first-tempo attacks, with setter and opposing team as random effects, and block type (multiplayer block TRUE/FALSE) as the response variable.↩