
Everything in volleyball is intertwingled
2020-04-14
Ben Raymond, Adrien Ickowicz, Mark Lebedew, John Forman.
With Lauren Bertolacci, Bart De Gieter, Heima Keita, Michael Mattes, Francesco Oleni, Miguel Rivera, Shinnosuke Uehara, Alberto Varela, Oliver Wagner, and Ruben Wolochin.
Competitors, despite their best efforts and intentions, often enter the playing arena with preconceptions about the game ahead. In many cases those preconceptions will be related to the perceived strength of their opponent, leading to a potential “psychological advantage”.
How those preconceptions manifest themselves might be seen in the level of aggression of each team. It is one of the truisms of sport that teams play to the level of their opponent, in both directions. A team facing an opponent that they believe to be stronger might play more aggressively in an attempt to overcome their perceived disadvantage.
In previous examinations we have used error rate as an indication of aggressiveness. As a team increases their aggressiveness and takes more risks, it is expected that their error rate in that particular skill area would increase. Winning in volleyball is a combination of break point phase and sideout phase. The main skills in which teams have control in those two phases are serving (in break point phase) and reception attack (in sideout phase). If a team were to change their level of aggressiveness in relation to the perceived strength of the opponent, we would expect to see changes in error rate in serving and in reception attack based on the opponent.
An example of serve errors
Let’s look at data from the men’s 2019 Volleyball Nations League, and plot serve error rate against the ranking of the receiving team. The blue line shows a smooth line of best fit to the data.
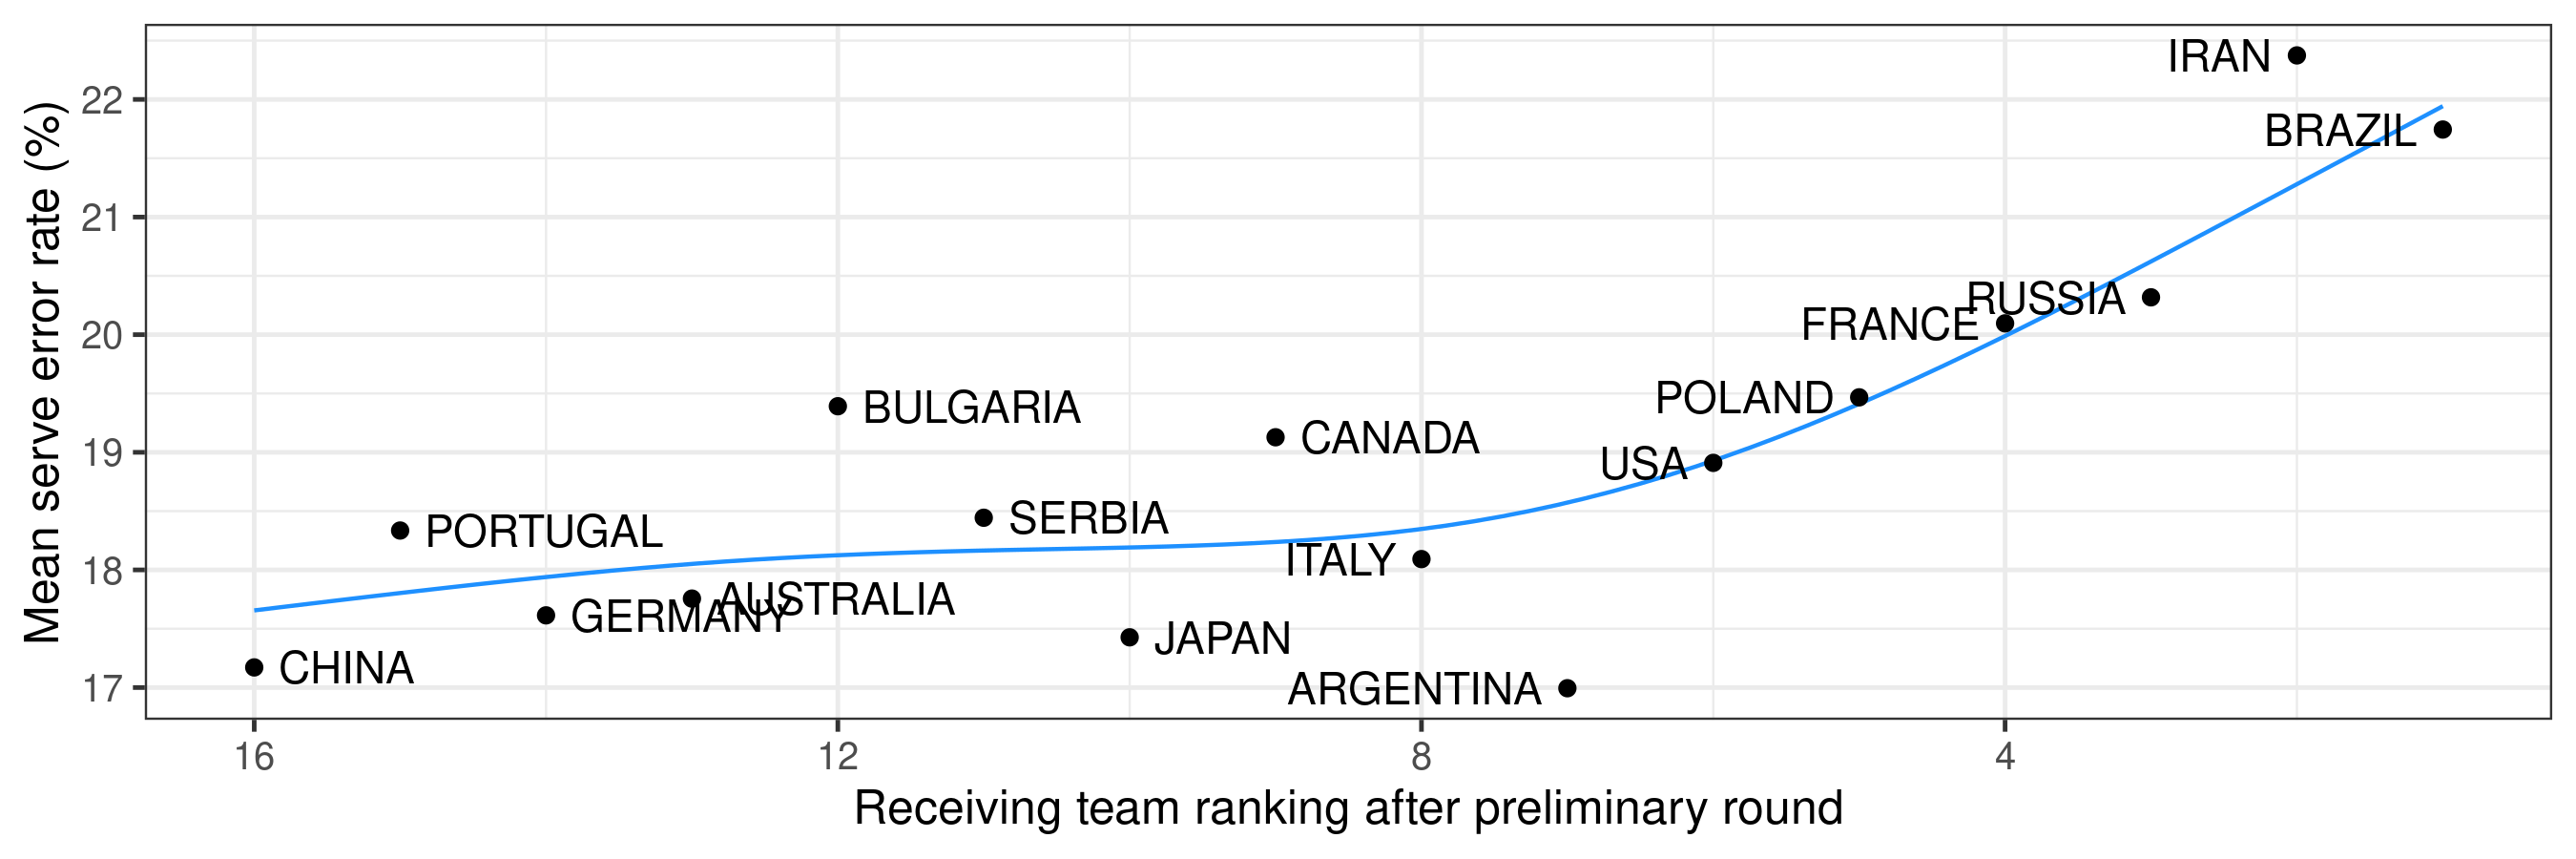
Which suggests that teams tend to make more serve errors against stronger opposition teams.
This is not surprising, since it is common for servers to serve more aggressively against stronger teams and we expect that serve error rate is likely to rise as a server tries to put more pressure on the receiving team. Teams might also use specific serving tactics to try and limit the strengths of an opposition team (deliberately serving an attacker who attacks less well or less often after passing, for example, or serving to particular areas of the court in certain rotations). However, those tactics might require higher-risk serves that increase the serve error rate.
(As an aside, there is an inherent circularity in using ladder position as a measure of team strength: a team whose opponents make more serve errors might win more matches because of those errors, thereby potentially affecting their position on the ladder. In that case, did the strength of the receiving team cause the serving teams to make more errors, or did the serving teams simply make more errors and thus make the receiving team look stronger on the ladder? We use different measures of team strength below, to avoid this circularity.)
How ubiquitous is this effect?
To check how widespread this effect is, we conducted a meta-analysis over a number of data sets. These data sets span international competitions and national leagues. Data sets were only included if they were relatively complete, including most or all matches from a particular competition, rather than team-oriented data sets that primarily only included matches in which the target team participated. Only regular season or preliminary round matches were included (i.e. no playoffs or finals) where practicable. We used modified sideout rate (hereafter “MSO”) as an indicator of team sideout strength. We used MSO rather than standard sideout rate because MSO excludes serve errors. Furthermore, the MSO of a team for a given match was calculated on the basis of its performance in other matches (i.e. excluding the target match). Thus, our estimate of a team’s sideout strength is independent of the number of serve errors that opposition teams made against them.
We also looked at reception attack error rate (that is, the error rate on attacks made immediately following serve reception). In this case we used modified breakpoint rate (“MBP”) as a measure of the opposing team’s strength. MBP was calculated here as points won on serve, but excluding serve aces and errors — thus being a reflection of a team’s defence and transition attack strength.
An overview of the data:
| Category | Men/women | N competitions | N matches |
|---|---|---|---|
| International | M | 6 | 461 |
| International | W | 6 | 434 |
| National | M | 35 | 4495 |
| National | W | 19 | 2223 |
As a first step in the analysis, for each data set we calculated the Spearman (rank) correlation coefficient between MSO and opposition serve error rate. A non-zero correlation indicates a relationship between the two. We similarly calculated the correlation between MBP and opposition reception attack error rate. These are plotted below:
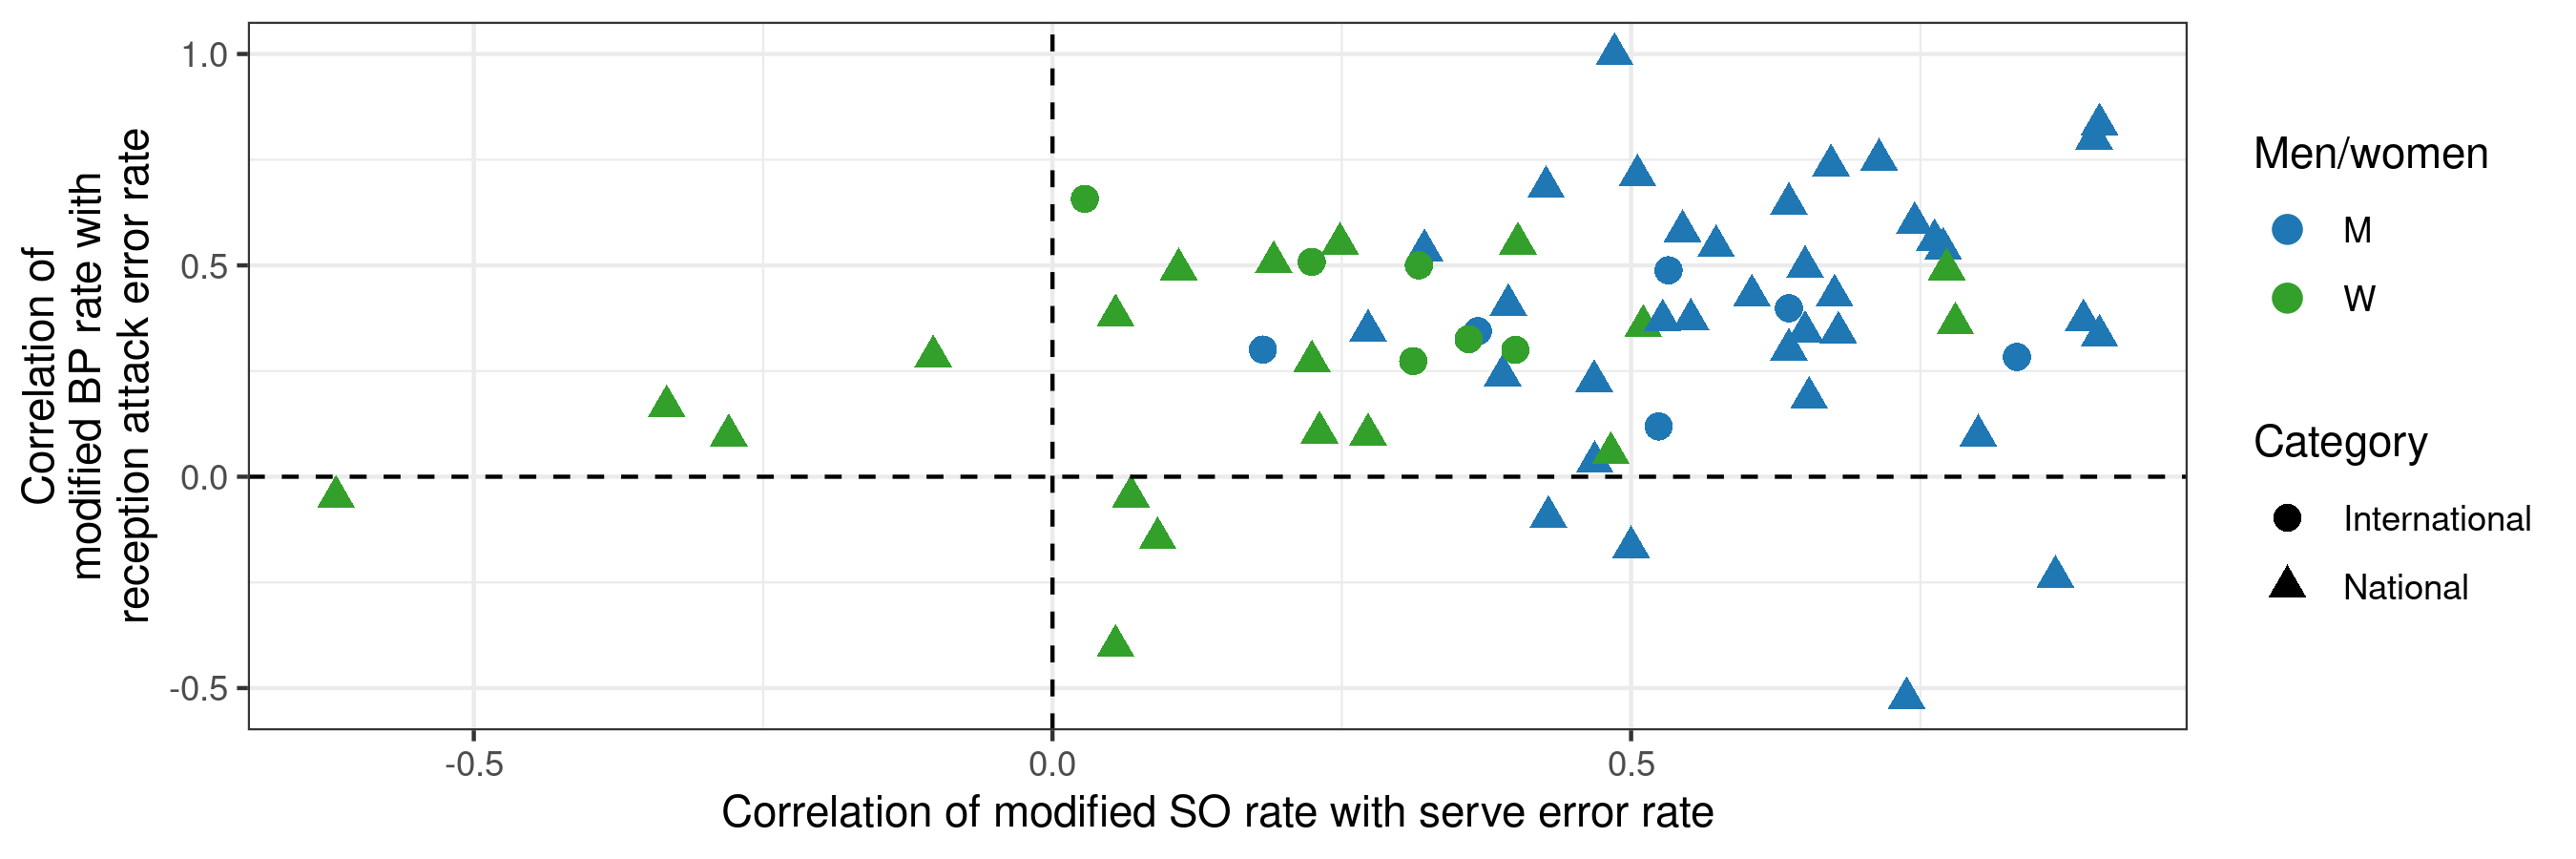
We can see that the majority of points lie to the right of the vertical dashed line — those are competitions in which the correlation between MSO and opposition serve error rate is positive (62 competitions out of 66). We can also see the blue points tend to lie further to the right than green points — that is, men’s competitions (blue) tend to have a stronger correlation between MSO and opposition serve error rate than women’s (green).
Looking in the vertical dimension, the correlation between MBP and reception attack error rate was positive (above the horizontal dashed line) in 58 competitions out of 66. There doesn’t appear to be an obvious difference in the vertical spread of green versus blue points — there is nothing obvious to suggest that reception attack error is more strongly correlated with opponent strength in men’s competitions than women’s (or vice-versa).
We can test these more formally by fitting statistical models. These are binomial models that give the probability of serve error as a smooth function of opponent MSO and a random effect by serving team. The random effect allows the model to handle variations in the average serve error rate by team, and thus the MSO term informs us about the change in serve error rate for the serving team depending on the strength of the opposition. The model structure for reception attack error is identical but as a function of opponent MBP. We did not have enough data to meaningfully explore differences between levels (i.e. international competitions vs national leagues) and so the models do not include a level effect.
The fitted models for serve error rate according to opposition MSO are shown below (the shaded bars show the confidence bands around each fit):
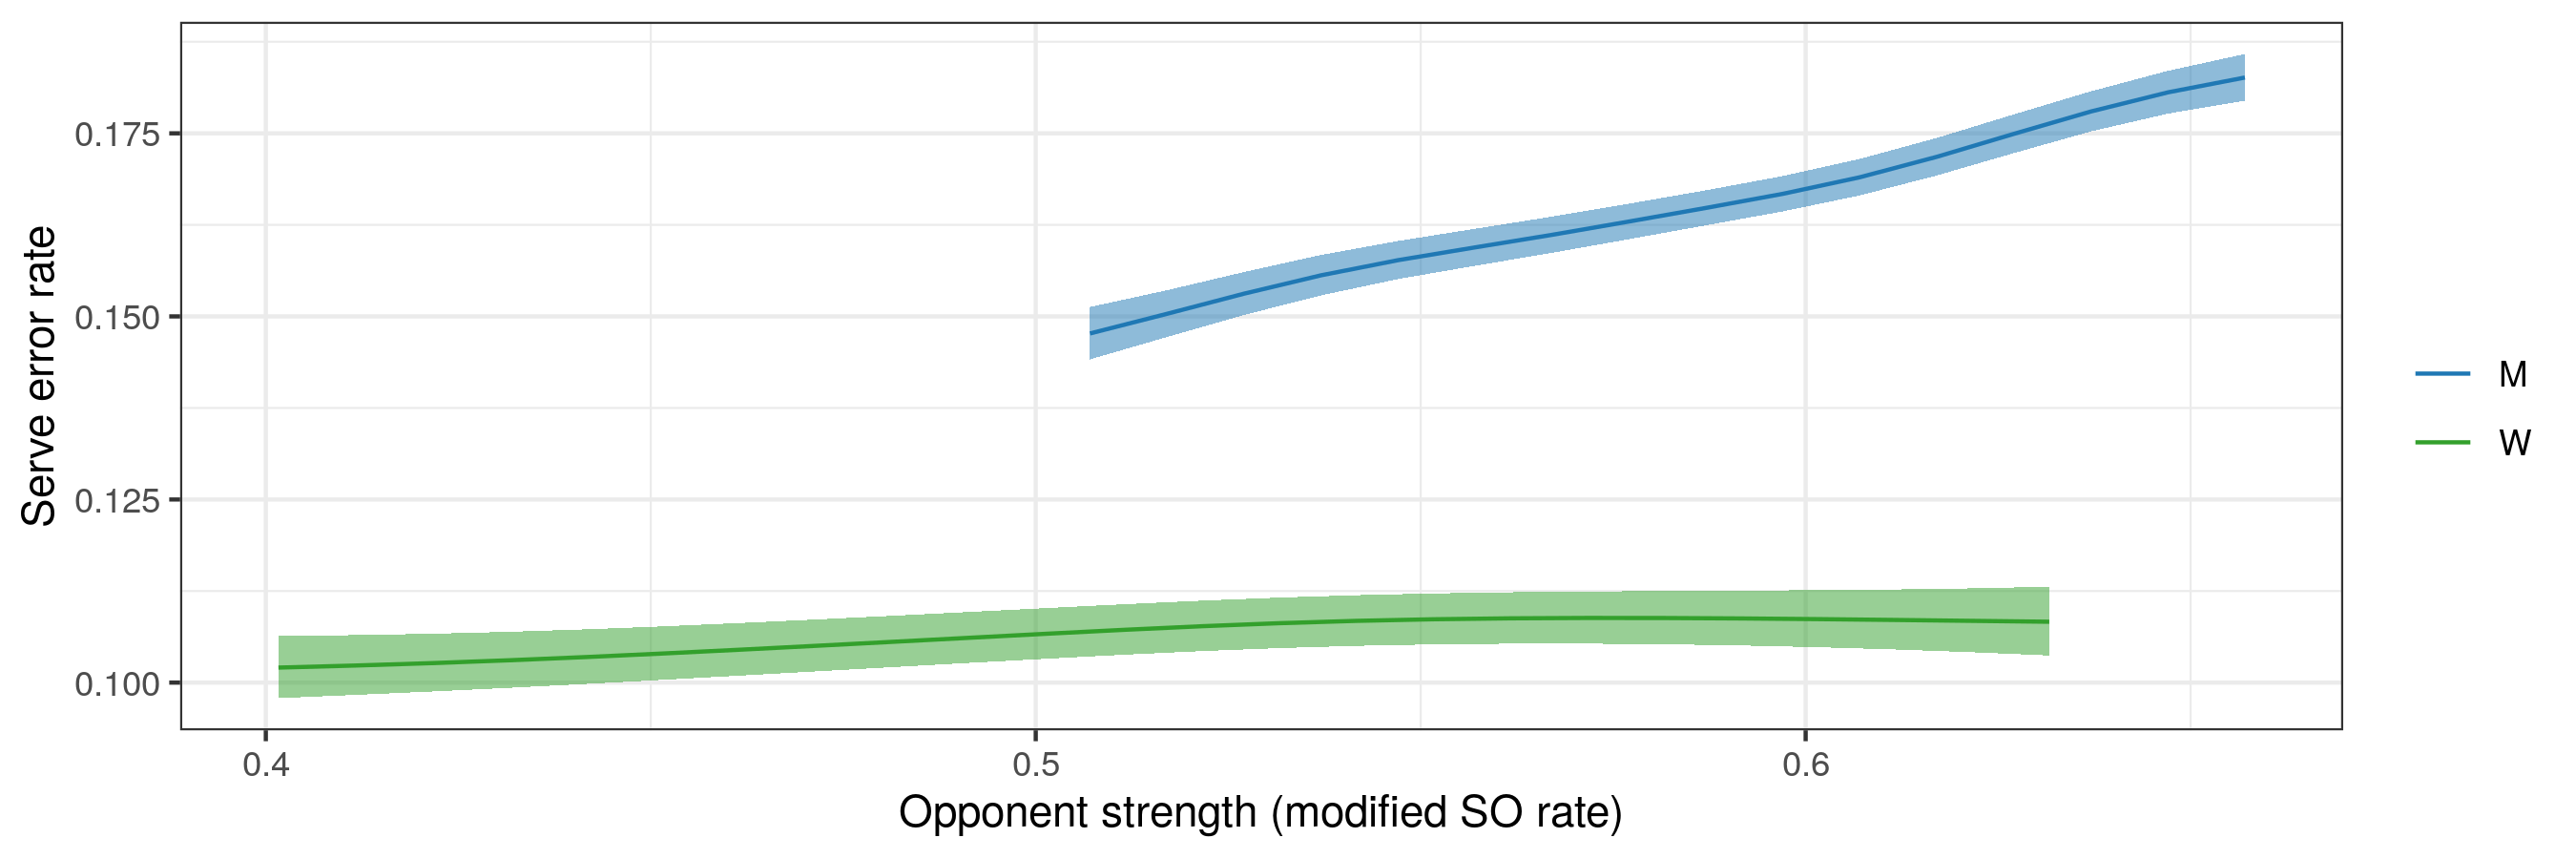
The men’s serve error rate is substantially higher than the women’s, almost certainly because of the higher jump serve rate in the men’s game. There is very good evidence for a positive relationship between men’s serve error rate and opposition MSO. There is also good evidence for a similar effect in the women’s game, but the strength of that relationship is much less pronounced (serve error rate only rising by 1% or so over the range of opposition MSO).
For reception attack error rate as a function of opposition MBP:
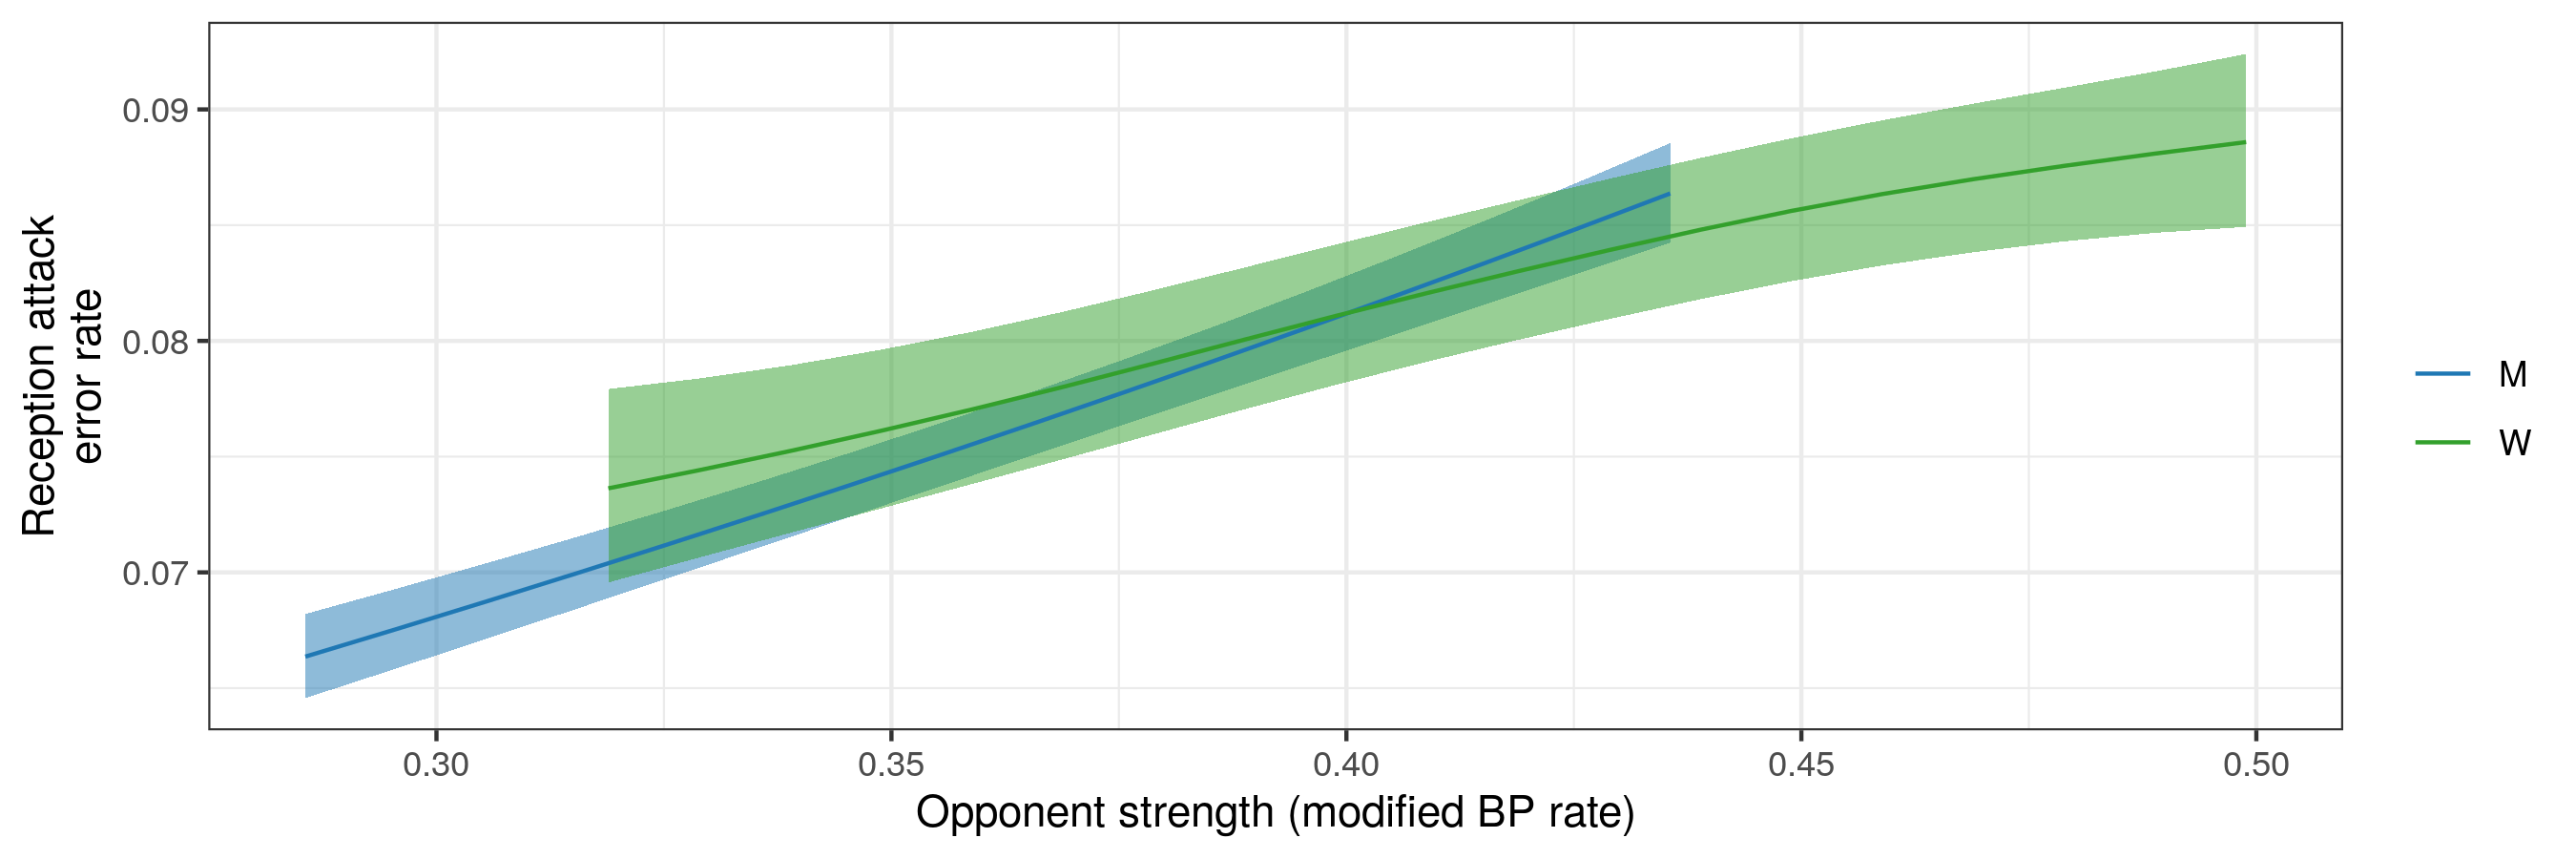
Here we see more consistency between men’s and women’s results. Men’s and women’s competitions showed differing ranges of MBP (different ranges on the x-axis), and with more uncertainty around the women’s relationship (wider bands, again reflecting the smaller data set and higher variability in the women’s data). Nevertheless, over their shared MBP range the two curves are quite similar, and show an increase in reception attack error rate with opposition MBP.
Conclusion
We see in the results that for both men’s and women’s volleyball, service errors and reception attack errors are related to the strength of the opponent. The weaker relationship for serve error rate in women’s volleyball could be explained by the fact that a far greater proportion of serves are float serves, which have lower ace and error rates and are therefore less sensitive to risk.
One potential explanation of the psychological factors at play here is this: a team/player believes that to beat a strong opponent they must play with a high level of risk in order to score points before the opponent has a chance for their natural superiority to take control. Thus, a weaker team serving against a stronger team will serve aggressively in order to keep the reception off the net and reduce sideout effectiveness. However, this aggressiveness carries an increased risk of making a serve error. Conversely, a better team need not risk giving a weak opponent free points by making service errors. In sideout phase, spikers from a weaker team expect a better team to have a better block and defence and so will make riskier attacks, targeting the extremities of the court and the edges of the block to reduce the defence’s chances of playing the ball. A stronger team can attack with lower risk, knowing that their greater quality will come through and they do not need to give away free points on attack errors.
The consistency and nature of these results suggest that the effect is psychological rather than technical. The measures used here for team strength (modified sideout rate and modified break point rate) are not explicitly known by the participants, suggesting that players are not basing their risk assessments on precise knowledge of those factors. The same applies when one considers coach’s instructions. Coaches can (and some do) include in their match plans a general guide on the level of risk in different areas, but even those who do are not explicit about the precise degree of risk that their players should take. The sensitivity of these results is interesting. We realize that the MSO and MBP rates are post-hoc in nature and drawn from the same data as the serve/attack errors, but nevertheless think they are likely to reasonably reflect a team’s prior expectations about their opposition.
It is extremely difficult to prove the existence of a psychological advantage let alone its precise value but these results seem to indicate that participants implicitly understand it.