
Previously, we produced a map of eucalypt height across Australia. Let's explore this a little further.
Environmental drivers
The ALA provides a comprehensive suite of environmental and contextual layers, giving information on properties such as climate, soil, and land use across Australia. There are 412 layers in this list at the time of writing. We'll pick five that we think might be relevant for determining the growth height of trees such as eucalypts:
- precipitation (annual total)
- solar radiation (annual mean)
- elevation (height above sea level)
- temperauture (mean annual maximum)
- wind speed (annual mean)
We then use a regression model to fit eucalypt height as a function of these variables. We'll use a random forest approach, which allows for nonlinear responses and interactions in the model. The fitted model has a mean squared error of 15.0, and explains about 65% of the variance in the data, which is encouraging. Which predictor variables are the most important, and how does height relate to the predictors? The partial effects plots can help answer these questions:
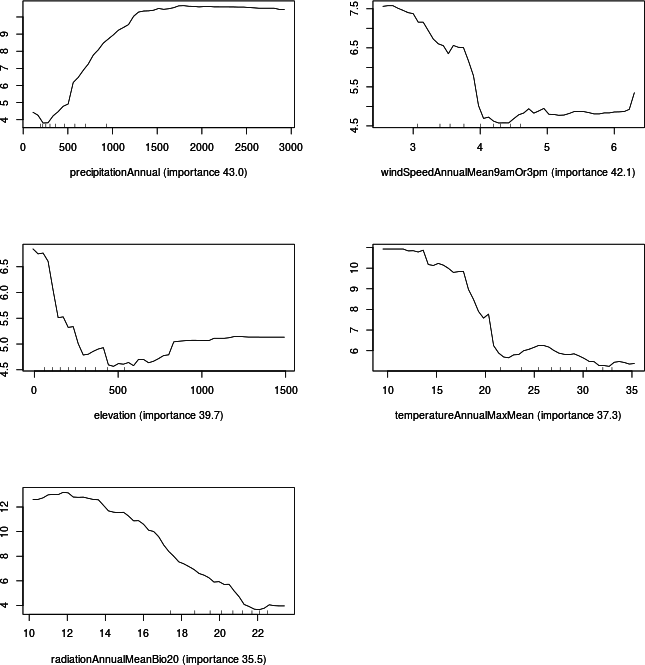
From the partial plots, we can see that tall eucalypts are associated with high rainfall, low wind speed, low elevation, and low radiation. The association with temperature is less clear: low temperatures (below about 20 °C) are associated with tall heights, but little of the data actually falls in this range (the small ticks along each x-axis indicate the deciles of the data).
Finally, we can use this fitted model to predict height across the full extent of Australia, thereby filling the gaps in our previous figure.
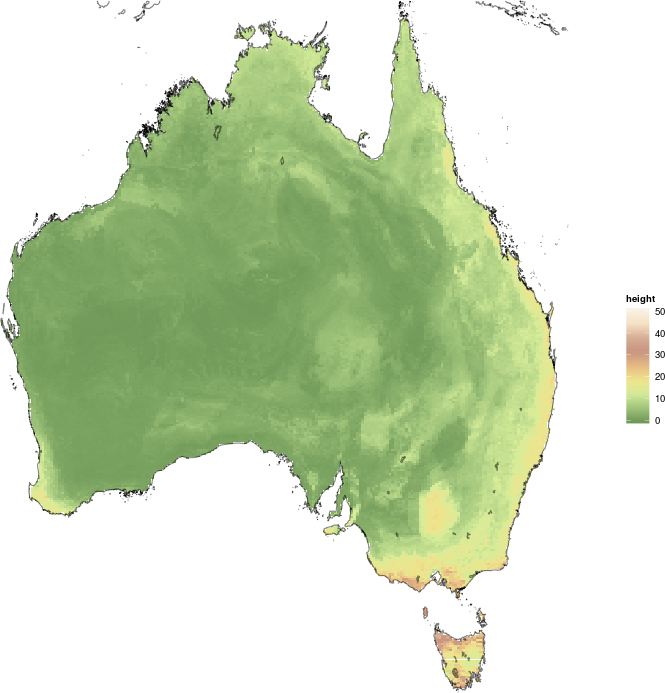
This retains the same general patterns as were seen in the raw data. The heights along the east coast are not quite as pronounced, and some localised patterns have not been captured by the model (e.g. the tall trees around Kinchega National Park, south of Broken Hill).
Once again, the R code is available.