Attack distribution: 2015/16 PlusLiga
Ben Raymond (ben@untan.gl), Mark Lebedew (@homeonthecourt)
How are volleyball attacks distributed on court, by starting and ending location?
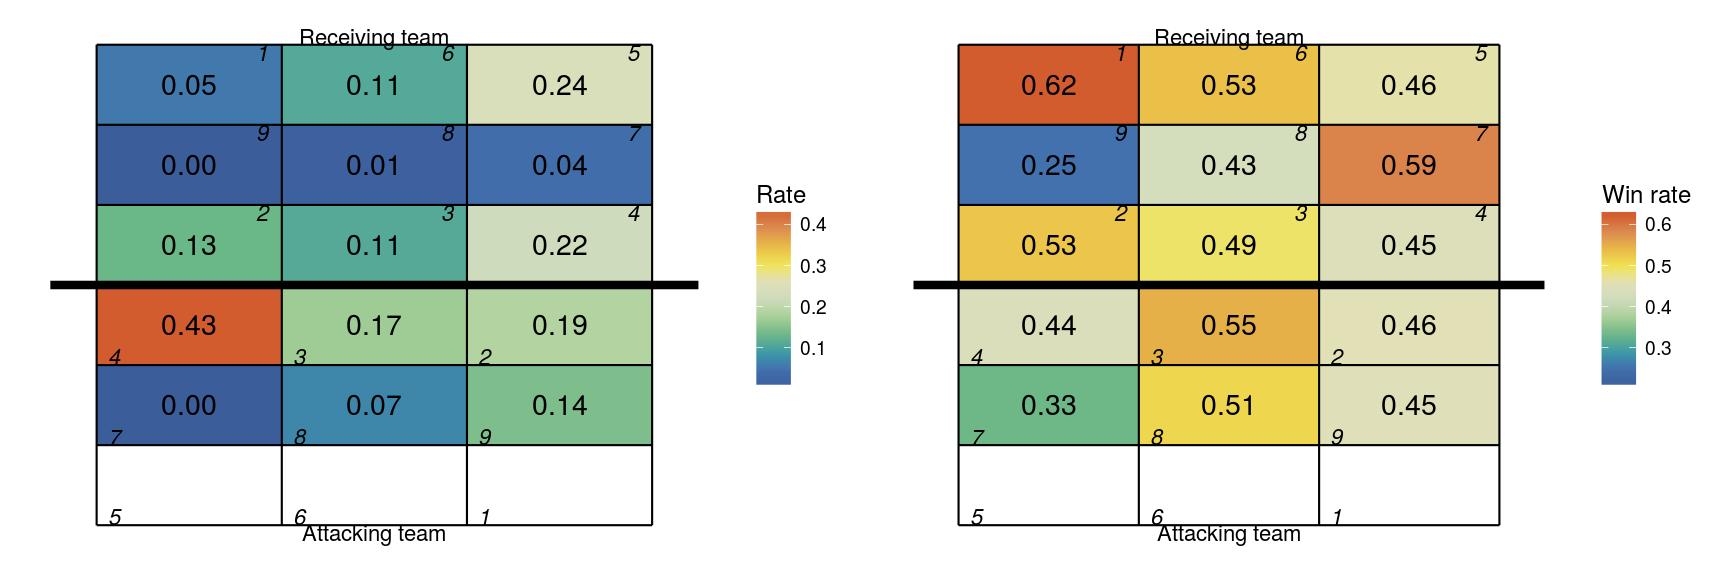
In the scouting data from the 2015/16 Polish League, most attacks are coded by starting and ending zone. First, the overall distribution by court position, as a heatmap:

Figure 1: (a) Attack rate and (b) attack success rate, by starting and ending zones of attacks. The lower half of the figure shows the starting location of attacks, and the upper half shows ending locations.
Most commonly (43% of the time) attacks are made from position 4, with most of the remainder from the middle (position 3) and right side (positions 2 and 9). The ending location of attacks is most commonly the left (positions 4 and 5) with most of the remainder the other two front row blockers (positions 2 and 3) and deep middle (position 6).
However, while attacks from position 4 are the most common, they are not the most successful. Middle and right-side attacks generally have a higher win rate.
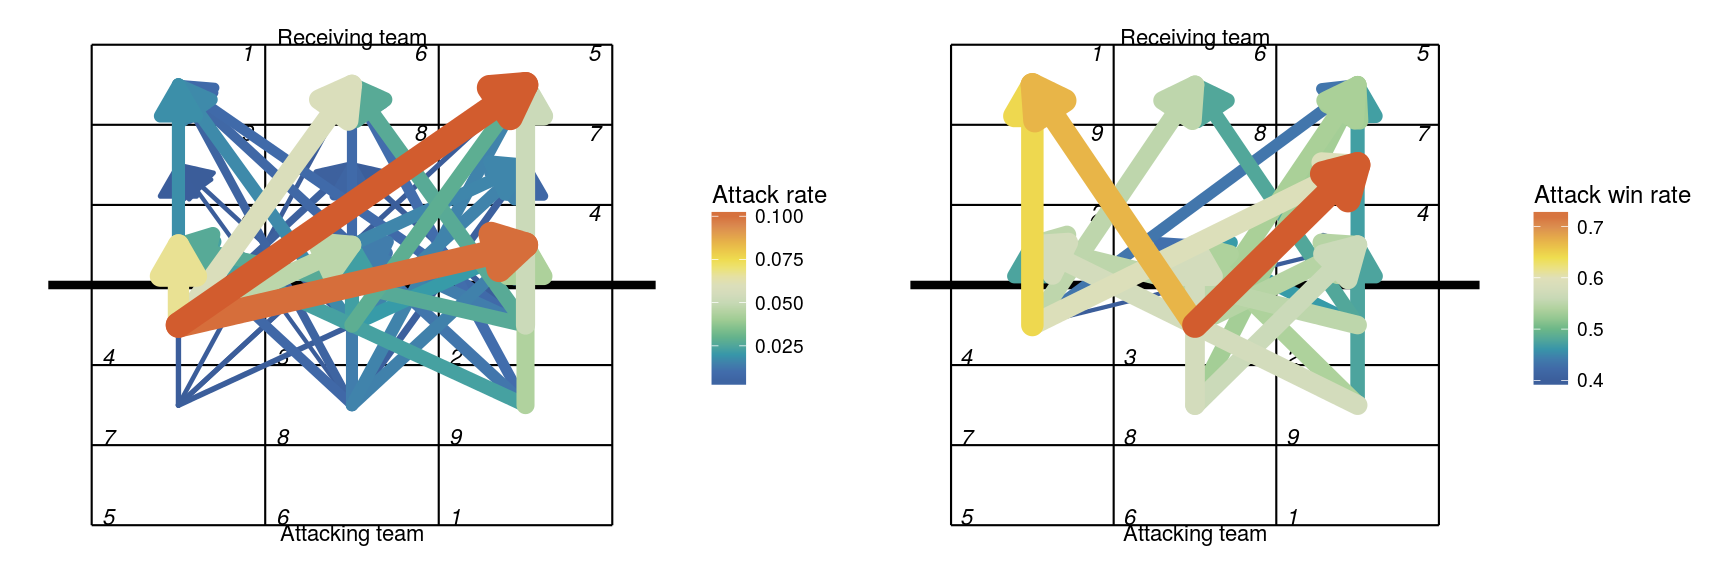
We can also show this information in more specific detail, using arrows to depict the starting and ending location of attacks.

Figure 2: (a) Attack rate (as a proportion of all attacks), (b) attack win rate; by starting and ending zones of attacks
Note that the right-hand panel in the figure only shows attacks with attack rate of at least 1% (i.e. excluding those attacks that make up less than 1% of all attacks).
Attacks with the highest success rate include angles from the middle (front row) hitter, and outside hits down the line (from position 4).
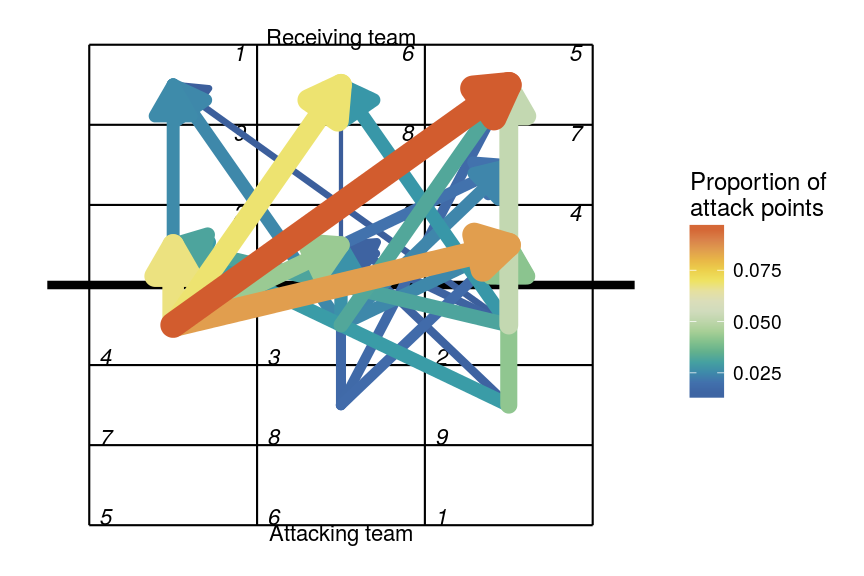
Note, though that these high-success attacks are not particularly common. If we combine attack rate with success rate, we can get a picture of the proportion of overall attack points scored by position:

Figure 3: Fraction of all points scored from attacks, by starting and ending zones of attacks (excluding attacks responsible for less than 1% of attack points)
And, not surprisingly, the majority of attack points are scored from position 4, with the most fruitful attacks being cross-court hits to positions 5 or 4.
See https://github.com/raymondben/datavolley for an R package for reading and analyzing DataVolley scouting files.
